- home
- articles
- quick answersQ&A
-
discussionsforums
- CodeProject.AI Server
- All Message Boards...
- Application Lifecycle>
- Design and Architecture
- Artificial Intelligence
- ASP.NET
- JavaScript
- Internet of Things
- C / C++ / MFC>
- C#
- Free Tools
- Objective-C and Swift
- Database
- Hardware & Devices>
- Hosting and Servers
- Java
- Linux Programming
- Python
- .NET (Core and Framework)
- Android
- iOS
- Mobile
- WPF
- Visual Basic
- Web Development
- Site Bugs / Suggestions
- Spam and Abuse Watch
- featuresfeatures
- communitylounge
- help?
Everything / Debugger
Debugger
debugger
Great Reads
by Bernhard Nebel
A tutorial for people who finally want to debug their Arduino projects that run on AVR MCUs using the GNU project debugger GDB
by Maxim Kartavenkov
The series of articles covers most aspects of logging and tracing mechanisms which can be embedded into your application.
by Christ Kennedy
A graphically bouncy and colorful version of the popular numbers tile-sliding game
Using Windbg to Answer Implementation Questions for Yourself (Can a Delegate Invocation be Inlined?)
by Ben M Watson
Learn how to use the debugger to answer implementation questions for yourself
Latest Articles
by Maxim Kartavenkov
Continue discussion of the simple kernel drivers tracing mechanisms by using output information into the handles of the files pipes and console passed to the driver from the host application.
by Maxim Kartavenkov
The series of articles covers most aspects of logging and tracing mechanisms which can be embedded into your application.
by Bernhard Nebel
A tutorial for people who finally want to debug their Arduino projects that run on AVR MCUs using the GNU project debugger GDB
by Bernhard Nebel
Interrupts can confuse one when single-stepping through a program; dw-link mitigates this problem.
All Articles
26 Jul 2013 by
I'm developing a C# assembly which is to be called via COM from an old vb6 (ie, "native" win32, not .net) application. I've installed VS2010 Premium in a W7 x64 and simply my goal is to use Visual Studio to debug the C# code...Other hint: the C# assembly is compiled in "x86 mode" (.NET4)...
18 Jun 2017 by abdul subhan mohammed
Dear All, I have create winform application using c#. Where i'm blocking some application(like: mspaint.exe, notepad.exe, etc...) while running this winform-application. I debug and run the application, performmed all task. And exit the application. But, still the application is running under...
17 Mar 2014 by Abhinav S
You have followed all steps right, however these links might just help you -http://msdn.microsoft.com/en-us/library/y7f5zaaa.aspx[^]Remote debugging for Visual Studio from different domains[^]
11 Sep 2018 by ahmed_sa
Problem How to know which events fires from start of windows form running like load then textchanged etc.... . I have some variables on load of form . these variables have override to it . but i dont know on which place or event fires after load this windows form is very big coding lines ...
15 Dec 2013 by Allgaeuer
Hello folks,Is it possible to create a full memory dump of a Windows service when it crashes? Obviously, there are the well known postmortem debuggers, which can collect a memory dump of a failing process. But the problem with Windows services is that they are running within the...
3 Jul 2013 by Apriorit Inc, prepa1
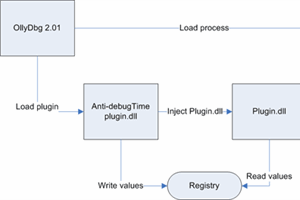
This article describes the implementation of a simple tool to deal with debug blocking based on the function execution time
27 Oct 2015 by Are Riff
Microsoft Visual Studio CodeI'm new to programming. I've been practicing for over two months now.I just love VS Code, it's fast to launch to start coding.How can I setting it up to compile or debug my code in it?The settings are all confusing.I also have VS 2015 and MinGW (C:\MinGW)...
8 Jan 2014 by astrovirgin
Hi Guys, I am working on a C# windows application. I am facing a wierd problem in my code. I am using a dropdown to get some date. There are two events to change the value, one for ValueSelected and another for ValueChanged. Whenever I run that code while debugging, it show the correct...
8 May 2013 by ayesha hassan
My following code is compiled successfully and runs perfectly for sometime handling 40 clients but after sometime, it gives an error "Debug Assertiion Failed expression: (_osfile(fh) & fopen)".I searched on internet and found a solution:Project + Properties, Configuration properties,...
6 Jan 2022 by Bernhard Nebel
Interrupts can confuse one when single-stepping through a program; dw-link mitigates this problem.
16 Dec 2017 by Biswal Tanmaya
8 Nov 2015 by Bounze
I have an emergency here: I'm developing a web app using ASP.Net MVC 5 in VS 2015 and all of the sudden I can't run it while debugging; I don't know what has gone wrong.- Using IIS Express v.10- Visual Studio Community 2015; Version 14.0.23107.0 D14REL; Framework 4.6.00081- Windows 7...
8 Nov 2015 by Bounze
Found the solution!!Please protect your screen before reacting to what you're about to read (lol)...So I kept on looking on the Internet for possible solutions (after 3 days of this) and found one suggesting to go and add an exception for DEVENV.exe. I did, but still no dice. So I...
7 Sep 2015 by C3D1
Hello,i am using VC6++.I have several *.lib projects in my workspace and some *.exe projects.For the *.exe projects PDB-Files were generated normally (im coming from VC2010 so i am really new to VC6) but when i compile the *.lib projects, no PDB Files are generated.I've checked the...
3 Jul 2015 by chenghuichao
21 Feb 2014 by CHill60
11 Sep 2018 by CHill60
The Microsoft Documentation has an article specifically on the order of events - Order of Events in Windows Forms | Microsoft Docs[^] EDIT after OP comment One way to track the order of events in controls or objects is to log them - you will need to use the IDE to generate the code stub for...
9 Dec 2021 by codefast1993
22 Aug 2016 by CPallini
18 Jun 2017 by Dave Kreskowiak
You question doesn't make sense. If the process being debugged terminates, the debugging session also terminates. It didn't "go anywhere" and there is only one reason why "it disappeared", the process being debugged ended. Also, the point behind writing an application that "blocks" other...
22 Oct 2018 by Dave Kreskowiak
If you're looking for someone to do your work for you, you've come to the wrong place. You haven't spelled out any problem you're having nor asked a question.
20 Feb 2018 by den2k88
My Google-fu is failing hard, I was looking throug google and the MSDN search for a page I'm fairly sure I saw some time ago which listed all the debugger magic values for memory initialization, lice 0xCC for stack memory, 0xCD for allocated clean heap memory and so on. What I have tried: I...
26 Jan 2023 by DrgIonuţ
I have updated Visual Studio 2019 from 16.6.1 version to 16.11.23 version. The update operation was finished successfully. When I want to run my MVC project in Debug mode, nothing happens. No error is displayed, the app is not running. What do I...
29 Oct 2012 by E.F. Nijboer
9 Jul 2014 by George Jonsson
28 Dec 2013 by goddamndmn
I am using Visual Studio 2012, c++ with /clr.When i'm debugging function void foo2(int w, int h), and move instruction pointer in any way, my arguments w and h are reset to zeros!Code:// MyClass.hpublic ref class MyClass{public: foo1(int a, int b); foo2(int w, int...
26 Jan 2023 by Graeme_Grant
You do know that the current version is VS2022 17.4.4? As for why it does not run, there is not enough information supplied. Try closing VS, then manually deleting the OBJ, BIN, and .VS folders. Restart and do a clean build. Check that you have...
23 Mar 2013 by gssajith87
Whenever you have a new piece of code added to the existing code that you are debugging, First thing is you should build the Solution once again and continue to debug.In case if you are debugging a exe that is running from a different location than that of your Project Folder, For...
25 Apr 2013 by H.Brydon
Make sure that you compile your code with the "Debug" setting which will enable all sorts of things for you.
12 Jul 2015 by HOoman.2012
6 Mar 2018 by HusseinAl-haj
As we know, the ptrace system call is one of the most powerful system calls in unix-like systems. All debugging software use ptrace for monitoring and manipulating another process, i.e. tracee. Using ptrace, we can track read/write system call in the tracee process. I ask, can we use ptrace in...
24 Jan 2013 by Itai Basel
If your VS debgger is running slow and you checked out all other tips with no help - maybe you unchecked this one and forgot to recheck it after you were done.
9 Jul 2014 by jishnu123
any body please help me to put debugger.launch(); in my dll project (VC++)static bool SampleDbCall (){ debugger.launch(); // syntax error int retValue = ARRF_ADD_ON_RET_FAILURE; ROW record = NULL; int logbuflen = 0; int i = 0; QueryObject *query =...
16 Jan 2014 by KarstenK
your problem is the "scope" of the variables, because you have bad (and too short) names. You have the w and h NOT ONLY as class members, but also as function parameters.There is a "hungarian notation", where every class member gets a "m_" and type ("i" for int) prefix:int m_iw;int...
16 Dec 2014 by Kinna-10626331
Hello I have 3 projects in one solution ( 2 WPF projects and one C# empty Project theme).Also they have references to different .dlls .My problem is : 2 executables ( from one of the 2 WPF projects ) and multiple .dlls are been generated in the bin/debug and bin/release directories. Looks...
27 Jan 2016 by Konstantin A. Magg
I am working on an article about diagnosing errors and analysing behavior of larger native C++ applications. The scenario would roughly look like this:Application runs stable for hours or days in production-like environment.Software consists of several processes, mostly native C++. Some...
30 Mar 2018 by krishna Dev
Hi, I have two solutions lets say SolutionA and SolutionB. Here SolutionB has class library which is referred in SolutionA. Now I want to step-in through the SolutionB from SolutionA while debugging it. Please assist. Many Thanks What I have tried: I tried this, sort of working but not...
27 Oct 2015 by Krunal Rohit
Umm, possible solution could beDebugging in Visual Studio[^]Navigating through Code with the Debugger[^]Mastering Debugging in Visual Studio 2010 - A Beginner's Guide[^]Basic Debugging with Visual Studio[^]-KR
17 Mar 2014 by Kucera Jan
Hi,please help me with the following problem. I want to debug a process in a remote system. The process loads DLLs and I want to hit a breakpoint in one of them. I compiled this DLL and placed it into that system. Then I connected remotely to the system by the debugger. But VS2010 shows...
14 Jun 2020 by Kyudos
I have some third party Win32 code that uses lots of big structures. Throughout the code, the elements of these structures are referred to via #define variables a la: #define hFrmWnd (w->hFrmWndW) This effectively hides them from the...
9 Jun 2012 by larssy1
Dear fellow developers, At the msdn page the psupport gave me, there is described that the maximum used memory for a 256-MB device is 90 MB (94371840).Now I have been testing this at several places when launching the app, and it turned out that the used memory for my application is: 59...
7 Sep 2015 by Leo Chapiro
Go to Project Settings, Link. Select the Category: "General" and check the "Generate Debug Info" box. After that, you can select the Category "Debug" and change settings about the debug file.Take a look as well at /PDB (Use Program Database) Visual Studio 6.0[^]
25 Apr 2013 by liona
So I have just gotten VS2010 and the debugger doesn't want to stop at the most basic break point. for instance I fill a data set and the next line of code sets an integer to the the count of the rows in the dataset. I have setup two break points one before the ds fill and on on the integer row...
22 Oct 2018 by MadMyche
25 Nov 2013 by Mahyar Fayaz
Hi to alli want design event viewer for my projecti expect these event viewer make a a report of any bug or some warning problem in my projectand send each report to our serversomething like a event viewer in xp or 7 OS .please help me to design this event viewerin step 1: i...
14 Dec 2012 by Marshall Singh
Hey all,I am new to windbg.my intention is to debug my demo application (windows forms) and try to corrupt a specific function in the memory.i am attaching my app to windbg;fetching the address of a function (some button click, through x command) and putting an unresolved breakpoint...
19 Dec 2012 by Marshall Singh
5 Jul 2023 by Maxim Kartavenkov
18 May 2023 by Maxim Kartavenkov
26 Oct 2018 by Member 10546337
I am working in printer windows device driver code . Source code using microsoft cmd prompt to build which is windows sdk to build . I tried to debug the code using remote debugger . Breakpoint is not hitting . What I have tried: I tried to follow...
12 Dec 2016 by Member 10852608
7 Jan 2015 by Member 11360325
This is my problem, i have application that updates form data and prints after updating, problem is most of the time it works fine, i use webBrowser Control for printing because it print as html document, one function updates data second function filter according to last entered number and fill...
22 Aug 2016 by Member 12697792
26 Feb 2019 by Member 13697182
Hi ! I can't install (or use) Arduino debugger. So, below the complete steps I followed What I have tried: Step 0: OK : Creating Arduino program in Eclipse. I can write, download, and run Arduino program (sketch). Step 1: Done : setting up Eclipse IDE, adding GDB hardware debugging Step 2:...
24 Sep 2018 by Member 13995616
I am trying to set gdb so that I can debug C/C++ programs in Netbeans. I have MacOSX 10.13.6. I have followed exactly the same steps given in : First I created a certificate named gdb-cert and imported it in the System Keychain, then finally restarted the system, etc. debugging - Netbeans...
23 Nov 2012 by Member 9625106
Hello, in my application I got 2 Charts that are loaded by a DataContext.The problem is that i got differences between DEBUG and RELEASE.During the DEBUG (with SharpDevelop) the 1st one is working fine and the 2nd one working not really good (old values remains on the graph).During the...
26 Jun 2014 by Member 9821707
I am able to step into a stored procedure from my C# just fine, however, the step thru ends prematurely.From Visual Studio, I step thru a few lines in the stored procedure, then as if the connection timesout, execution leaves the stored procedure and returns back to the C# code without...
20 Feb 2018 by Mike Diack
Try Inside CRT: Debug Heap Management[^] But from my own notes also: This is a list of some of the know magic numbers used by Microsoft which can be useful to know when debugging an application. 0xABABABAB Guard Bytes used by HeapAlloc() or LocalAlloc to mark "no man’s land" after allocated...
29 Oct 2012 by MitchG92_24
Hi all,I've had a look around the web but haven't been able to find the right answer - and due to my limited C# assembly knowledge, I turn to you!I have a WPF application that I have been running quite happily until today.When I run the program in the debugger it will run perfectly,...
7 Nov 2017 by Mohammed Hameed
When we open a project/solution in Visual studio, the project's vshost.exe file will be executed and launched in memory automatically (I think this is done by Visual studio) and this process (vshost.exe) will be in running state till we close the solution from VS.I know that this process has...
21 Feb 2014 by Muhamad Faizan Khan
my vs 2012 working fine but suddenly now an error is occurring thatmicrosoft visual studio 2012 has stopped workinga problem caused the program to stop working correctly windows will close the program and notify you if a solution is available[debug] [close program]now what the hack is...
16 Feb 2013 by Nitin_Garg
Macro to attach visual studio debugger to w3wp apppool hosting your webservice.
8 Mar 2015 by OriginalGriff
In C# you almost never deal with memory addresses - in fact, you have to do two things at compile time in order to be allowed anywhere near them! First, you have to change your project properties to allow unsafe code, and then you have to mark the relevant code as an unsafe block in order to use...
27 Jan 2016 by Patrice T
Quote:What do you think, what are your experiences? Did I miss an important concept or approach? Do you have special tool recommendations (or aversions ^^)?My experience is:When I deal with C or C++, I have a special behavior at quotation level.If I am requested to build an app, I do normal...
12 Dec 2016 by Patrice T
Quote:how to write simple debuggerWriting a debugger is anything but simple.Quote:i want to set hardware breakpoint to address in the memoryModern OS are pretty complicated and the handling of memory is pretty complex.I recommend to use existing debuggers, the one of your IDE is a good...
9 Apr 2014 by ravikhoda
HI all,i have a weird problem in visual studio. i open a solution web application apply some code change on one of the web pages and run the project. it allows to add breakpoints but the new lines that i have added do not highlight with normal yellow color like it should happen. and also the...
3 Sep 2022 by reverser69
hi I'm writing a C++ app for Linux in windows environment. I can debug fine, but when an exception occurs or when stepping the last line of main function, VS freezes. to make the VS responsive again, I kill its connection. now, I don't know if...
19 Sep 2019 by ribash1816
Firstly, I am very new to c++. Pardon my lack of knowledge. This is a work project. We're running VS 2005 to develop in one machine and Remote Debugger to Debug the application(.exe) in another machine (both of of the machine do not have any internet connections). The application builds just...
25 Jun 2013 by Richard MacCutchan
25 Jan 2014 by Richard MacCutchan
You need to think about this in logical terms, rather than in assembler terms. Each letter should be repeated according to its position in the alphabet. So the program should be something like:Set letter := 'A'Set count := 1Loop: Set repeat := 0 Print: Display letter...
21 Feb 2014 by Richard MacCutchan
Collect all the detailed information and report it to Microsoft; it's their product.
28 Mar 2018 by Richard MacCutchan
You only need a single instance of the debugger to do this. Start debugging the executable project, and when it makes a call to the class library use the "step into" button (or F11), to follow the path through the library code.
26 Feb 2019 by Richard MacCutchan
19 Sep 2019 by Richard MacCutchan
You will need to trap the exception in the debugger and look at the call stack, in order to find where in your code the error is generated. Always remember that just because the application build without errors does not mean it is error free.
28 Sep 2017 by Rick York
You have to supply them a debug version of your executable because MFC can't mix debug and release mode modules. You don't have to supply them your source code though and I am not sure whether you have to supply them a symbol file, the .pdb. They have to make a debug build and specify command,...
10 Jun 2013 by Rob Philpott
You can turn it off. Go to your project settings and uncheck the 'Enable the Visual Studio hosting service' on the debug tab.
8 Mar 2015 by Roland-HE-C#
7 Sep 2015 by Santhosh G_
27 Feb 2012 by Sebastian Solnica
29 Dec 2013 by Sebastian Solnica
In this post, I will present you my MDbg plugin (includes a command: inject) that adopts the funceval API and an example diagnostics case in which I used it.
10 Jul 2015 by Sebastian Solnica
26 Jul 2013 by Sergey Alexandrovich Kryukov
You can do what you tried to do, it works. Probably, you did not show some detail where you screw up this method of debugging.But it can be much simpler. 1) Load the solution with your assembly with Visual Studio. 2) Make your assembly project a startup project ("Set a StartUp Project" in...
17 Mar 2014 by Sergey Alexandrovich Kryukov
This is not about the presence of your DLL module itself. You need to create and enable debug information (in particular, PDB, please see below), which may require rebuild of you module with different (debug) options. You can learn Visual C++ documentation on debug information and appropriate...
9 Mar 2015 by Sergey Alexandrovich Kryukov
You are talking about managed memory. Let me tell you that the problem itself is not correctly posed. "Managed addresses" are not just something which is tricky to work with, never needed, or like that. The thing is: in certain sense, they don't even exist. The mapping between process linear...
28 Sep 2017 by SheepSpeech
Hi, I'm creating an application using C++ and MFC. My app loads several MFC extension DLL from its "Plugins" folder during execution, and the user can choose which one he wants to launch in a list. However, if someone wants to make a MFC extension DLL for my app, and only have the executable...
9 Apr 2014 by Sriram Bala
Hi Ravi,Step 1: Check you are building the project in Debug mode.Step 2: Delete the bin & obj folder and rebuild the project. Step 3: Press ctrl+f5 to clear the cache in the browser page. Setp 4: .pdb file gets generated on build which is the one help us debugging.Step 5: In the...
2 Dec 2013 by Stefan_Lang
You can set a "data breakpoint" after you started a debugging session. To declare a data breakpoint, set a normal breakpoint somewhere in the part of your code that can see the variable or data address in question, some time before the problem occurs. Start the debugger and wait for it to break...
11 Dec 2012 by Tarun Batra
I am getting an error in mine window service that i made in VS2010 using VC++when service is stopped i am getting an error "An unhandled win32 exception occurred in myservice.exe[1260].Just in time debugger failed with following error:No installed debugger has just in time debugging...


