Click here to Skip to main content
15,892,059 members
Articles / Web Development / ASP.NET
Article

Using Visual Studio to Debug JavaScript in IE

Rate me:
Please Sign up or sign in to vote.
4.74/5 (27 votes)
24 May 2007CPOL2 min read 215.3K   57   32
Using Visual Studio to debug JavaScript in IE can really speed up your JavaScript development and save you some headaches

Using break points to debug your javascript

Introduction

Anyone who has done some work with JavaScript knows it can be very frustrating. Often you have to use: Alert("I am here"); type of code to debug it. Visual Studio and IE (Internet Explorer) have the ability to debug JavaScript code, including setting break points in your JavaScript.

Background

When I started working in .NET, I was a VB.NET Windows programmer. When I started to use ASP.NET, the need to use JavaScript started to come up. It was easy for me to make mistakes in my JavaScript since it is a C based language, so there was a real need to have the ability to debug my JavaScript code. I don't think I would have ever ventured into the JavaScript world without being able to debug it in Visual Studio.

Setup

In IE you have to enable script debugging. Go to Tools, then Internet Options. Click on the Advanced Tab. Un-check disable script debugging (Internet Explorer). It is checked by default.

Advanced tab to enable script debugging

NOTE: you will find with script debugging enabled that many Internet sites have lots of JavaScript problems. So I would suggest only turning this on when you want to debug your JavaScript otherwise you will be bothered by IE asking you if you want to debug other peoples bad JavaScript.

Once you have this set, a new option is available in your View menu. If you click on View there is now a script debugger option. If you are using IE 7 you will need to click on Tools, then Menu bar to see the View menu item.

Screenshot - Scriptdebug1.gif

So at this point in Visual Studio, if you set your web project / web site to debug mode and run it, you can debug your JavaScript.

Under View/Script Debugger there are two options. The first is Open.

Screenshot - Scriptdebug3.gif

This will open the HTML/JavaScript in Visual Studio and allow you to set break points in your JavaScript.

Screenshot - Scriptdebug4.gif

The other option is Break at next statement which does just what it says. When the next JavaScript gets run, you will go into Visual Studio and it will break on the first JavaScript line.

Screenshot - Scriptdebug6.gif

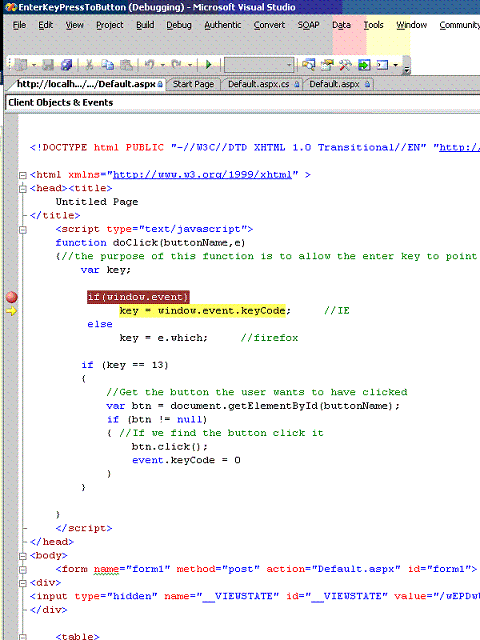
Once you are in the Visual Studio debugger, you can use all of the normal tools you have to investigate variables etc. to help with the debugging of the JavaScript code.

Using VS tools to debug

Conclusion

I have found that being able to debug my JavaScript has really helped me to find all the small problems and bugs that are so easy to create when writing JavaScript code.
I hope this article helps you in your JavaScript debugging.

License

This article, along with any associated source code and files, is licensed under The Code Project Open License (CPOL)


Written By
Software Developer (Senior)
United States United States
I started my programmer career over 26 years ago doing COBOL and SAS on a MVS mainframe. It didn't take long for me to move into windows programming. I started my windows programming in Delphi (Pascal) with a Microsoft SQL server back end. I started working with vb.net when the beta 2 came out in 2001. After spending most of my programming life as a windows programmer I started to check out asp.net in 2004. I achieved my MCSD.net in April 2005. I have done a lot of MS SQL database stuff. I have a lot of experience with Window Service and Web services as well. I spent three years as a consultant programing in C#. I really enjoyed it and found the switch between vb.net and C# to be mostly syntax. In my current position I am programming in C# working on WPF and MSSql database stuff. Lately I have been using VS2019.

On a personal note I am a born again Christian, if anyone has any questions about what it means to have a right relationship with God or if you have questions about who Jesus Christ is, send me an e-mail. ben.kubicek[at]netzero[dot]com You need to replace the [at] with @ and [dot] with . for the email to work. My relationship with God gives purpose and meaning to my life.

Comments and Discussions

 
QuestionThanks.. it works for me Pin
vipul200821-Jul-15 1:29
vipul200821-Jul-15 1:29 
QuestionIt work with any browser ?? Pin
Eng Kerollos Adel18-May-15 2:18
Eng Kerollos Adel18-May-15 2:18 
GeneralMy vote of 3 Pin
AparnaSpan11-Jul-14 5:06
AparnaSpan11-Jul-14 5:06 
GeneralRe: My vote of 3 Pin
kubben11-Jul-14 5:08
kubben11-Jul-14 5:08 
GeneralIs there a system field that hold the value of a JavaScript delimiter? : or $ Pin
smcirish10-Mar-09 4:16
smcirish10-Mar-09 4:16 
GeneralRe: Is there a system field that hold the value of a JavaScript delimiter? : or $ Pin
kubben10-Mar-09 4:25
kubben10-Mar-09 4:25 
GeneralRe: Is there a system field that hold the value of a JavaScript delimiter? : or $ Pin
smcirish10-Mar-09 4:47
smcirish10-Mar-09 4:47 
GeneralRe: Is there a system field that hold the value of a JavaScript delimiter? : or $ Pin
kubben10-Mar-09 4:50
kubben10-Mar-09 4:50 
GeneralRe: Is there a system field that hold the value of a JavaScript delimiter? : or $ Pin
smcirish10-Mar-09 6:05
smcirish10-Mar-09 6:05 
GeneralRe: Is there a system field that hold the value of a JavaScript delimiter? : or $ Pin
kubben10-Mar-09 6:11
kubben10-Mar-09 6:11 
GeneralRe: Is there a system field that hold the value of a JavaScript delimiter? : or $ Pin
smcirish10-Mar-09 6:43
smcirish10-Mar-09 6:43 
GeneralRe: Is there a system field that hold the value of a JavaScript delimiter? : or $ Pin
kubben10-Mar-09 7:50
kubben10-Mar-09 7:50 
GeneralRe: Is there a system field that hold the value of a JavaScript delimiter? : or $ Pin
smcirish10-Mar-09 7:58
smcirish10-Mar-09 7:58 
GeneralRe: Is there a system field that hold the value of a JavaScript delimiter? : or $ Pin
kubben10-Mar-09 8:07
kubben10-Mar-09 8:07 
GeneralThanks it is giong to help all JS user Pin
santosh d30-Jan-09 19:21
santosh d30-Jan-09 19:21 
GeneralRe: Thanks it is giong to help all JS user Pin
kubben31-Jan-09 1:12
kubben31-Jan-09 1:12 
GeneralThank you! Pin
mohamed antar4-Aug-07 3:28
mohamed antar4-Aug-07 3:28 
GeneralRe: Thank you! Pin
kubben4-Aug-07 6:15
kubben4-Aug-07 6:15 
Questionwhat abt web resource file Pin
Mukesh.C.Gupta30-May-07 19:32
Mukesh.C.Gupta30-May-07 19:32 
AnswerRe: what abt web resource file Pin
kubben31-May-07 1:49
kubben31-May-07 1:49 
GeneralSome Other Debugging Tips [modified] Pin
nickyt30-May-07 3:01
nickyt30-May-07 3:01 
Kubben,

You wrote:
"NOTE: you will find with script debugging enabled that many internet sites have lots of javascript problems. So I would suggest only turning this on when you want to debug your javascript otherwise you will be bothered by IE asking you if you want to debug other peoples bad javascript."

This is true, but I would not recommend toggling this on and off as you might wonder sometimes why the debugger is not firing. I know it sounds obvious to enable debugging in Internet Explorer (IE) , but I've seen it happen to many people and they never bother to check the obvious. A better idea is to have a windows account on your machine (your developer account) that has IE setup to be in debug mode for developing web applications. As well set your cache in Internet Explorer to the lowest number of MB possible. Also set your IE cache options to check "Every visit to the page".

Also be wary when debugging a static HTML page. If you make changes to a static HTML page, it doesn't always get updated, even with the above caching options set. I get around this by adding a querystring and changing it whenever I make changes to the HTML page. This only applies to you current browser session. If you close the browser and open the page again, it should be updated.

There is also a cool tool called the IE Developer Toolbar that you might want to check out, http://www.microsoft.com/downloads/details.aspx?FamilyID=E59C3964-672D-4511-BB3E-2D5E1DB91038&displaylang=en

This is all great if you're debugging only IE (probably a corporate scenario), however in the wonderful world of the Internet, more than IE needs to be supported.

Yes, I know IE still dominates, but 15% or whatever Firefox is at these days, is still a lot of people and Mac users are all about Safari or Firefox. Basically you want as many people seeing your site and seeing your site well.

Sooo....

Firefox has a cool add-on called FireBug, https://addons.mozilla.org/en-US/firefox/addon/1843, as well as another cool tool called the DOM Inspector which comes with Firefox by default.


You also might want to look into JSDoc, http://jsdoc.sourceforge.net, and JSUnit, http://www.jsunit.net, for speeding up development in the long run because you have API docs to reference and creating code that follows a certain standard.

Cheers,
Nick Wink | ;)
____________________________
www.learn-ajax.com

GeneralRe: Some Other Debugging Tips Pin
kubben30-May-07 3:17
kubben30-May-07 3:17 
GeneralAnother side note Pin
Brad Ford29-May-07 7:36
Brad Ford29-May-07 7:36 
GeneralRe: Another side note Pin
kubben29-May-07 7:41
kubben29-May-07 7:41 
Generalthanks! Pin
stefano piuri29-May-07 2:47
stefano piuri29-May-07 2:47 

General General    News News    Suggestion Suggestion    Question Question    Bug Bug    Answer Answer    Joke Joke    Praise Praise    Rant Rant    Admin Admin   

Use Ctrl+Left/Right to switch messages, Ctrl+Up/Down to switch threads, Ctrl+Shift+Left/Right to switch pages.