Introduction
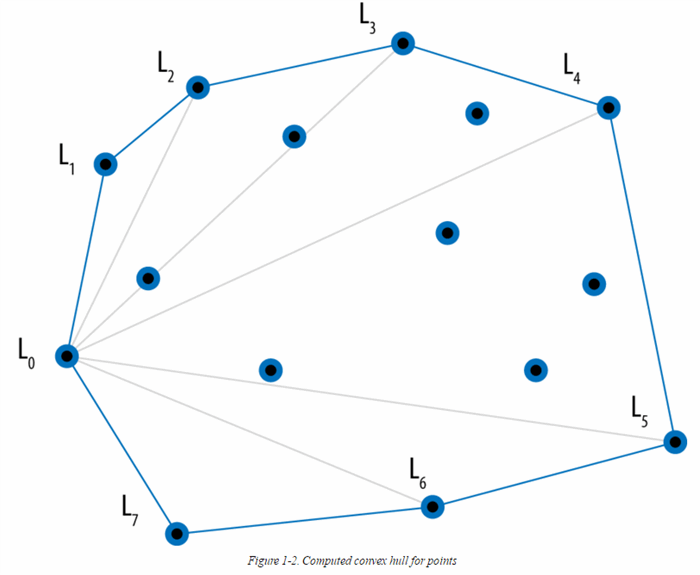
While reading the newly released book Algorithms In A Nutshell 2nd ed. (amazon link opens in new window/tab), I became interested in the first algorithm example in the book which discusses how to calculate the convex hull of any set of points. The convex hull is the set of points which surrounds all other points on the grid.
Sample Image from the book:
Background
However, to learn how to do this I needed test data. It seemed kind of boring to just fill an array with points and do the calculations with no output so I decided that I wanted to draw the points and display them.
Deployment Challenges of A Graphics Library
But, to draw and display points you are inherently bound to some graphic library which may not be available to many users without forcing them to install some component or library. Enter, HTML5 Canvas...
HTML5 Canvas: No Deployment Necessary
If you are reading this article at CodeProject then you have everything you need to see the code run (a web browser). Yes, your browser does have to support HTML5 and have JavaScript turned on but that's a fairly small requirement these days.
See the Working Project (Such As It Is)
It also makes it extremely easy to see the working project without requiring the users to download anything but instead just pointing them to a URL. You can see the (final) project at my web site:
http://raddev.us/TrapPoints (opens in a new window/tab)
At the time of this writing it looks like:

Functionality As of This Writing
- A light green background grid is drawn simply to provide user with a space to add points
- User can add points simply by clicking anywhere in grid
- Clicking [Connect Points] button draws a line from each point to next point and closing path by connecting last point added to first point.
- At this time, click the [Calc Hull] button draws triangles using each group of 3 points through the array of points. (this is a step on the way to the final algorithm)
How This Article Will Proceed
Even though the version of the app may be further along (dependent upon how much I've worked on the project and whether I've completed the algorithm) I am going to start out at the most basic with the code and add the versions of the code as separate downloads.
This will allow you to learn the code in separate chunks. For example:
Step 1: set up the HTML, JavaScript and libraries (jQuery, bootstrap and main JS file) to load.
Step 2: write the code that sets up the Canvas and draws the background
Step 3: write the code that allows the user to add points and draw them on grid. We'll also add the code which allows you to clear the points.
Step 4: write code that connects the points
That will probably be enough for this article and then we'll complete the actual algorithm in part 2.
In the second part of this article we will continue where we left off and complete the following items.
Step 5: Discuss my first shot at implementing the Convex Hull algorithm via drawing triangles with each set of 3 points within the entire set of points.
Step 6: Implement the working solution that calculates the hull.
Let's get started by creating the basic files we need for our project framework.
About the Code Downloads
You can see that there are 4 versions of the code attached to this article. That way you can download each version and progress through the article.
Step 1 Begins Here
Create HTML Project Framework
The first thing we need to do is create our set of files for our project. I like to create a folder structure like the one shown in the following image for my simple HTML5 projects:
You can see that I have the main folder (TrapPoints) and then I create a folder to hold the JavaScript (js) and a folder to hold the CSS (Cascading Style Sheets) (css). I also name the project's main html file index.htm so it will generally load by default when you point a browser at the URL.
You can also see I have a .git folder in the project simply because I'm using Git VCS.
Naming Project Files
I simply name the JavaScript file after the project so in this case it's called TrapPoints.js.
My CSS file is main.css.
HTML Project File
The index.htm file simply contains all the references to our javascript and css files and it also contains references to a couple of libraries that I'm using.
Bootstrap and jQuery
I am using Bootstrap simply because it is an easy library to get some nicely styled controls (buttons, etc). I'm using jQuery because Bootstrap requires it anyways and it provides a nice API for selecting HTML elements etc.
Download Base Project Code Files Now
You can get the base code for this project by downloading the TrapPoints_v001.zip now if you want to follow along with the code changes.
Starting Code Example
If you download the first version you will see that the base htm file does contain all the references you need to get started and load all the libraries.
I won't display the entire HTML file here because it really just provides a way to load everything else and I'll let you look at it but I will show you the one line of HTML which displays a button and uses the Bootstrap styling to show you how easy it is to use.
<button onclick="connectPoints();" class="btn btn-primary">Connect Points</button>
Add HTML Class, Adds Bootstrap Styles
Notice the class="btn btn-primary" in that line. That is what styles the button so it is the blue color with the nicely rounded edges. Bootstrap makes it that easy.
If you download the starting code and load it you'll see that there is no grid yet but the buttons are styled via Bootstrap. It looks like the following:
I didn't take a large snapshot because it's all just an empty white background.
JavaScript Base Code
The project also includes some very basic JavaScript in the TrapPoints.js. Let's take a look at that code.
var ctx = null;
var theCanvas = null;
window.addEventListener("load", initApp);
function initApp()
{
theCanvas = document.getElementById("gamescreen");
ctx = theCanvas.getContext("2d");
ctx.canvas.height = 650;

ctx.canvas.width = ctx.canvas.height;
window.addEventListener("mousedown", mouseDownHandler);
}
function mouseDownHandler(){
}
Initializing Global Variables
You can see that I initialize a few global variables that I know are going to be used later.
Canvas Context
The first two are going to be used to keep track of the HTML5 Canvas element which we will be using to draw.
The third line of code references the main window object of the browser so we can add an event listener.
We want to know when the entire HTML and all of it's components (libraries) are loaded so we can do our work. We tell the browser to notify us when the page is done loading by calling the addEventListener method.
Starting the Application
We provide a parameter (2nd one) that is the name of the function we want to run when the browser is done loading. This is what starts our application. Starting our application in the OnLoad event insures us that all of our libraries are completely loaded so that when we go to use them they will be ready to go.
Our initApp Method
One the page and all resources are loaded our initApp() method will fire and inside that method we do a bit of intialization.
Get Reference to Canvas Element
The first thing we do is get a reference to the HTML element that represents the Canvas. The <canvas> tag is a new element added in the HTML5 specification which is expressly used for drawing in HTML.
If you take a look at the HTML you'll see that element looks like the following and we've added the id attribute so we can identify it in code.
<canvas id="gamescreen">You're browser does not support HTML5.</canvas>
That value (gamescreen) is the same value we use in the call to get a reference to the element from our JavaScript:
theCanvas = document.getElementById("gamescreen");
Since jQuery is available to use, we could've done the following:
theCanvas = $("#gamescreen").get(0);
Once you have reference to the <canvas> element you can call HTML5 specific functions on it.
The first one you have to call is getContext("2d");
That method retrieves the context that we will use throughout the app because it exposes the 2D context object that allows us to call the HTML5 API which allows us to draw on the screen.
Set Height and Width of Canvas Area
Next, we set two properites (height and width) on the Context object which allow us to set the effective area of the HTML5 canvas which will show up on the screen.
ctx.canvas.height = 650;
ctx.canvas.width = ctx.canvas.height;
Of course, you can't see that area yet, because it is white like the rest of the HTML window area.
Finally, we add another event listener so we can do some work when the user clicks his mouse button. Right now that will respond to either button being clicked but we'll fix it later so it is only called when the left button is clicked.
That's it for the first step. At this point you have a framework that is ready to do some work with the HTML5 canvas.
Step 2 Starts Here
Now we'll do the work to draw the background.
You can get the completed code for this step by downloading TrapPoints_v002.zip at the top of this article.
Draw the Background Grid
When the app first loads we want to draw the background grid so the user knows the limits of where she can add points.
The first thing I want to do is initialize some values we'll use with the grid. Since I want to see 20 lines horitzontally and vertically I'm going to simply divide the width (same value as height) by 20 to calculate a lineInterval value so I can draw lines horizontally and vertically on the canvas.
I also add the gridColor variable which uses a predefined HTML value for the grid line color.
I'll add the three variables at the top of our trappoints.js as globals:
var LINES = 20;
var lineInterval = 0;
var gridColor = "lightgreen";
Initialize the Grid
Next, I want to add a new method that will set up and use these values:
function initBoard(){
    lineInterval = Math.floor(ctx.canvas.width / LINES);
    console.log(lineInterval);
    draw();
}
I'm calling it initBoard() because this just needs to run once. I'll add a call to this method in our initApp() method so the app will:
- load all associated files
initApp() will set up the 2d context and the restinitApp() will call initBoard() and draw the initial grid.
In initBoard we do the simple calculation to determine the grid lines and save the value in our global variable.
Then, we call a new method to do the actual drawing, aptly named draw();
Draw the Grid Using 2D Context
Drawing the grid is very easy because we can use some simple math and a for loop to iterate through the height and width of the canvas area drawing our lines at intervals. The code looks like:
function draw() {
ctx.globalAlpha = 1;
ctx.fillStyle="white";
ctx.fillRect(0,0,ctx.canvas.height,ctx.canvas.width);
for (var lineCount=0;lineCount<LINES;lineCount++)
{
ctx.fillStyle=gridColor;
ctx.fillRect(0,lineInterval*(lineCount+1),ctx.canvas.width,2);
ctx.fillRect(lineInterval*(lineCount+1),0,2,ctx.canvas.width);
}
}
globalAlpha
The first line that sets the globalAlpha value sets the opacity of the items we are drawing so they are fully opaque. A value of 1 is the max with decimal values representing values of translucence that becoming greater as the value reaches zero.
fillRect Fill Canvas
Next, we set the fillStyle to another predefined HTML color (white) so we can render the entire canvas area in white.
To fill the entire canvas with white we call the fillRect method starting at the upper left (0,0) and filling it all the way to point x = 650, y = 650 so the entire rectangle of canvas is filled.
Draw Grid Lines
Finally we draw all of the grid lines by simply iterating through the canvas slightly moving the point where we begin our lines each time before we draw the line.
Notice that for each of the gridlines I draw I actually call fillRect() to do the work. Although I could've called the lineTo() method which is another way to draw a line. I use fillRect because these are slightly thicker and I would've had to call lineTo() more than once do that work. This was just easier.
At this point, you have your grid and the app will now look like the following:
Step 3 Begins Here
Now the code becomes a little more fun, because we are going to draw some points when the user clicks her left mouse button.
Download the Completed Code
Download the completed code for this step by getting TrapPoints_003.zip at the top of this article.
Get Mouse Position
The first thing we need to do is capture the mouse position when the mouse is clicked.
To do that we need some basic JavaScript to do this work. I wrap it up in a function called getMousPos()
function getMousePos(evt) {
var rect = theCanvas.getBoundingClientRect();
var currentPoint = {};
currentPoint.x = evt.clientX - rect.left;
currentPoint.y = evt.clientY - rect.top;
return currentPoint;
}
In this case I was using theCanvas element to get a bounding rect in order to get the offset of where the canvas is drawn in relation to the HTML canvas element. However, this doesn't matter in this program because we know that the canvas is taking up the first 650 x 650 pixels on the page.
Next, we simply get the X and Y values and store them in a point object that we can use later when we draw the point on the canvas.
We run the getMousePos() method each time the user clicks a mouse button.
The mouseDownHandler() fires each time the user clicks a mouse button. Our first iteration of the method looks like the following:
function mouseDownHandler(event){
    if (event.button == 0){
        var currentPoint = getMousePos(event);
        if ((currentPoint.x > 650) || (currentPoint.y > 650))
        {
            return;
        }
        console.log(currentPoint);
    }
}
The first thing to notice is that the mouseDownEvenHandler() method actually takes one argument that we've named event. That parameter is handed to our method by the original browser event that fires (mousedown).
That parameter carries extra information which provides values for which button was clicked and the coordinate values of where the pointer was located. You can see all the details about it at Mozilla's great reference (https://developer.mozilla.org/en-US/docs/Web/Events/mousedown^ ).
Determine if Left Button Is Clicked
The first thing we do is make sure we only respond if it is the left button which is clicked. If the event.button value is zero then the left button was clicked.
Determine If Coordinates Are In Canvas
Next we determine if the coordinates where the button was clicked was in the canvas area (x < 650 and y < 650).
In this first revision, I simply made it output the coord values to console. Let's change it to do our work now.
Save and Draw Each Point
I'm going to add a new method called drawPoint() and allow it to draw the new point each time one is added.
I will also add a new array (allPoints) to store all of the points which are drawn on the canvas.
var allPoints = [];
var DIAMETER = 10;
function drawPoint(currentPoint){
    ctx.beginPath();
    ctx.arc(currentPoint.x, currentPoint.y,RADIUS,0,2*Math.PI);
    allPoints.push(currentPoint);
    ctx.stroke();
}
The allPoints array is a global variable because we will need to be able to access it from other methods.
In the drawPoints() method we call a few of the HTML5 Canvas drawing methods. First we use beginPath() to set up the context for drawing. Next, we us the arc() method to draw the actual point (which is a circle outline).
Context Arc Method
The first two parameters to the arc() method are the x, y location of the center of the circle that you are drawing. The third parameter is the radius of the circle (distance from the center of the circle to the side). We've preset that to a global variable constant named RADIUS and set it to 10 (pixels).
The arc() method's 4th and 5th parameters represent the radians of an angle around the circle. In our case we start at zero (3 O'clock position on circle) and we move 2*Math.PI radians counterclockwise around the circle which draws a complete circle.
To draw the actual point we call the context stroke() method and the point will appear. Since we want to store each point for use later we simply push it onto our allPoints array by calling allPoints.push().
That completes the circle drawing and the point will now render each time the user clicks on the canvas.
Here's what it looks like after I clicked a few places on the canvas.
Clear All Points
At this point, I'm also going to add the Clear functionality because it is so simple and it'll allow you to draw new sets of points by simply clicking the [Clear] button.
function clearPoints(){
allPoints = [];
draw();
}
Step 4 Begins Here
Download
You can download TrapPoints_v004.zip for the final version of this step.
Now, all we need to do is add a function that will draw a line from each point in the allPoints array.
Basically, since we have all the points in the array, we simply use the moveTo() and lineTo() methods provided to use by the HTML5 Canvas context. I've broken up the work into two separate functions. The first one is called connectPoints() and it calls the drawLine() functionality which does the actual drawing work.
function connectPoints(){
console.log("connecting points...");
if (allPoints === null || allPoints.length < 3){
console.log("there are not enough points to do calculation.");
return;
}
for (var x = 0;x < allPoints.length-1;x++){
drawLine(allPoints[x],allPoints[x+1]);
console.log("x+1 : " + x+1);
}
drawLine(allPoints[allPoints.length-1], allPoints[0]);
}
The connectPoints() method is called when the user clicks the [Connect Points] button. If there are not at least 3 points in our array then the method writes a message to the console and returns.
When there are at least three points in the array then it iterates through the points in the array and sends them to the drawLine() method. We send in two points to drawLine() (begin point and end point).
Drawing Each Connecting Line
function drawLine(p, p2){
    ctx.beginPath();
    ctx.moveTo(p.x,p.y);
    ctx.lineTo(p2.x, p2.y);
    console.log ("p.x : " + p.x + " p.y : " + p.y + " p2.x : " + p2.x + " p2.y : " +  p2.y);
    ctx.stroke();
}
Again, we use the beginPath method to set up our context for drawing. Next we move to the first point using the moveTo() method. And then we simply call lineTo() and stroke() to draw the line.
We also output the info related to the points to the console for simple debugging.
Enclosing the Points Into A Shape
Finally, notice that back in the connectPoints() method we use the last point to draw a point back to the first point to create a complete enclosed shape.
Version 4 : Complete Functionality
That's it. This completes all of our work and now with version 4 you can :
- add points
- connect the points
- clear the points and add more
Other Uses
Now that you have this basic functionality you can use this for other work you might want to do related to drawing a set of points and experimenting on your own.
Next Article
Next time we'll discuss the actual Create Hull algorithm more and complete our work to get to a solution that allows the user to put in all the points and calculate the hull automatically.
History
First revision of this article with first 4 versions of the app: 04-24-2016


