
A Powerful Chart Control
A control that displays multiple graphs simultaneously and automatically adds different scales
Introduction
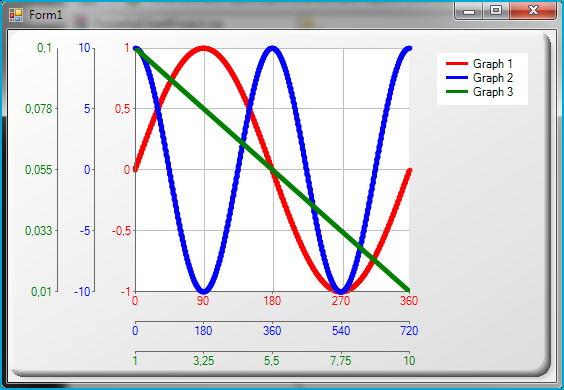
When I was developing a previous application, I needed to display various data in the form of line graphs. What I wanted was a universal control that could add and remove graphs (functions) as needed and, most important, this graph had to be displayed simultaneously and fit into the chart area regardless of their range.
Perhaps such solutions existed from third parties, but I wanted to stay with plain .NET, so I had to use Microsoft Chart controls and extend its functionality to make it suitable for my needs.
Background
The problem with various graphs is that they tend to have very different ranges, which makes it difficult to combine them on the same chart. Because the chart control sizes its scale to fit ALL the graphs, a graph that ranges from 1 to 100 would make another graph that ranges from 0.001 to 0.01 virtually invisible. Of course, at times this is what we need, but what if we wanted to visually compare two graphs regardless of their ranges?
We therefore need a chart area per graph or graphs that can be grouped (i.e., more or less equal ranges). These chart areas have to be stacked and each one must have its own axes, sized accordingly to the displayed graph. The result is a chart that has its graphs always scaled to fit the whole chart area.
Using the Code
Structure
The chart is basically a collection of different chart areas which are stacked together. For every single graph (or a collection of graphs of similar proportions), we need 3 different chart areas: one for displaying the graph, one for axis X and one for the axis Y. These chart areas are bound together with a guid number and make a whole.
As the original .NET chart does not provide such functionality, we tag every chart area using the purpose built class ChartAreaTagger:
/// <summary>
/// We use this class to tag our chart areas.
/// </summary>
private class ChartAreaTagger
{
    public ChartAreaTagger(Guid _guid, ChartAreaType _chartAreaType, Color _chartColor)
    {
        this.guid = _guid;
        this.chartAreaType = _chartAreaType;
        this.chartColor = _chartColor;
    }

    private Guid guid;
    /// <summary>
    /// This is the unique value that binds all three chart areas together (X, Y and Chart).
    /// </summary>
    public Guid @Guid
    {
        get { return guid; }
    }

    private ChartAreaType chartAreaType;
    /// <summary>
    /// This defines which type of chart area are we dealing with.
    /// </summary>
    public ChartAreaType @ChartAreaType
    {
        get { return chartAreaType; }
    }

    private Color chartColor;
    public Color ChartColor
    {
        get { return chartColor; }
    }
}

/// <summary>
/// This enumerates the three possible chart area types.
/// </summary>
private enum ChartAreaType
{
    /// <summary>
    /// This is for X axis labels.
    /// </summary>
    AXIS_X = 2,

    /// <summary>
    /// This is for Y axis labels.
    /// </summary>
    AXIS_Y = 4,

    /// <summary>
    /// This is for displaying our chart.
    /// </summary>
    CHART = 8
}
The class ChartAreaTagger provides all the information we need to put the various graphs on the chart and perform the layout.
GUI Elements
The chart inherits a UserControl and has a single object: the .NET chart control. The control has a chart area and a legend added in the designer - these are the two basic objects that will never change.
As we add and remove chart areas as needed, we do not provide specific formatting in the designer - we need a method in our code to do the job, so all chart areas will be formatted the same:
/// <summary>
/// The routine to format our chart areas (all are formatted the same).
/// </summary>
private void FormatChartArea(ChartArea _chartArea)
{
    ...
}
However, the base chart area, which we use for displaying the grid and holding all the graphs, needs a few exceptions, so we take care of this in the Load method:
this.chart1.ChartAreas[0].AxisX.LabelStyle.Enabled = false;
this.chart1.ChartAreas[0].AxisX.MajorTickMark.Enabled = false;
this.chart1.ChartAreas[0].AxisX.LineColor = Color.Transparent;
this.chart1.ChartAreas[0].AxisY.LabelStyle.Enabled = false;
this.chart1.ChartAreas[0].AxisY.MajorTickMark.Enabled = false;
this.chart1.ChartAreas[0].AxisY.LineColor = Color.Transparent;
Adding a Graph
Adding a graph starts with the checking whether a suitable chart area already exists on our chart. We do this by obtaining the minimums and maximums of the new graph and comparing this data with the existing one.
//obtain minimums and maximums...
float _minX = this.GetMinX(_points);
float _maxX = this.GetMaxX(_points);
float _minY = this.GetMinY(_points);
float _maxY = this.GetMaxY(_points);

//...so we can obtain the right chart areas
ChartArea _chartAreaAxisX = null;
ChartArea _chartAreaAxisY = null;
ChartArea _chartAreaChart = this.GetBestSuitedChartArea(
    _minX, _maxX,
    _minY, _maxY,
    out _chartAreaAxisX, out _chartAreaAxisY);
We are checking the percentage difference, so it is possible that the computed difference is going to be quite big when we are in fact dealing with small values.
For instance, we have two graphs, first has the range 0-100 and the second has the range 1-100. Obviously, the given graph could be put on the same chart area, but the percentage difference would compute 100% for the minimum (0 vs 1). As this is more than the MAX_PERCENTAL_DIFFERENCE, which is set to 10%, the graph would be put to its own chart area.
To deal with this, we also check the percentage difference in graphs proportions. So, if minimums, maximums and the proportions are out of MAX_PERCENTAL_DIFFERENCE, then the chart area is not suitable.
/// <summary>
/// Routine for obtaining the best suited chart area from the already present one,
/// based on the given chart proportions.
/// </summary>
private ChartArea GetBestSuitedChartArea(
    float _minX, float _maxX,
    float _minY, float _maxY,
    out ChartArea _suitableAxisX, out ChartArea _suitableAxisY)
{
    List<ChartArea> _suitableAxisXtmp = new List<ChartArea>();
    List<ChartArea> _suitableAxisYtmp = new List<ChartArea>();

    ChartArea _suitableChartArea = null;

    foreach (ChartArea _chartArea in this.chart1.ChartAreas)
    {
        //just a quick check if this chart area is even worth considering
        if (double.IsNaN(_chartArea.AxisX.Minimum))
        {
            continue;
        }
        if (double.IsInfinity(_chartArea.AxisX.Maximum))
        {
            continue;
        }
        if (double.IsNaN(_chartArea.AxisY.Minimum))
        {
            continue;
        }
        if (double.IsInfinity(_chartArea.AxisY.Maximum))
        {
            continue;
        }

        if (_chartArea.Tag is ChartAreaTagger)
        {
            ChartAreaTagger _chartAreaTagger = (ChartAreaTagger)_chartArea.Tag;

            #region "for X axis"
            if (this.GetPercentageDifference
            (_chartArea.AxisX.Minimum, _minX) > MAX_PERCENTAGE_DIFFERENCE)
            {
                if ((this.GetPercentageDifference(_chartArea.AxisX.Maximum - _chartArea.AxisX.Minimum,
                	_maxX - _minX) > MAX_PERCENTAGE_DIFFERENCE)
                    || (this.GetPercentageDifference(_chartArea.AxisX.Maximum, _maxX)
                    	> MAX_PERCENTAGE_DIFFERENCE))
                {
                    continue;
                }
            }
            if (this.GetPercentageDifference
		(_chartArea.AxisX.Maximum, _maxX) > MAX_PERCENTAGE_DIFFERENCE)
            {
                if ((this.GetPercentageDifference(_chartArea.AxisX.Maximum -
                	_chartArea.AxisX.Minimum, _maxX - _minX) > MAX_PERCENTAGE_DIFFERENCE)
                    || (this.GetPercentageDifference
                    (_chartArea.AxisX.Minimum, _minX) > MAX_PERCENTAGE_DIFFERENCE))
                {
                    continue;
                }
            }

            if (_chartAreaTagger.ChartAreaType == ChartAreaType.AXIS_X)
            {
                _suitableAxisXtmp.Add(_chartArea);
            }
            #endregion "for X axis"

            #region "for Y axis"
            if (this.GetPercentageDifference(_chartArea.AxisY.Minimum, _minY)
            	> MAX_PERCENTAGE_DIFFERENCE)
            {
                if ((this.GetPercentageDifference(_chartArea.AxisY.Maximum -
                	_chartArea.AxisY.Minimum, _maxY - _minY) > MAX_PERCENTAGE_DIFFERENCE)
                    || (this.GetPercentageDifference
                    (_chartArea.AxisY.Maximum, _maxY) > MAX_PERCENTAGE_DIFFERENCE))
                {
                    continue;
                }
            }
            if (this.GetPercentageDifference
            (_chartArea.AxisY.Maximum, _maxY) > MAX_PERCENTAGE_DIFFERENCE)
            {
                if ((this.GetPercentageDifference(_chartArea.AxisY.Maximum -
                _chartArea.AxisY.Minimum, _maxY - _minY) > MAX_PERCENTAGE_DIFFERENCE)
                    || (this.GetPercentageDifference
                    (_chartArea.AxisY.Minimum, _minY) > MAX_PERCENTAGE_DIFFERENCE))
                {
                    continue;
                }
            }

            if (_chartAreaTagger.ChartAreaType == ChartAreaType.AXIS_Y)
            {
                _suitableAxisYtmp.Add(_chartArea);
            }
            #endregion "for Y axis"

            //if we are here, that means that both X and Y axes are suitable,
            //so the chart area is suitable as well.
            if (_chartAreaTagger.ChartAreaType == ChartAreaType.CHART)
            {
                _suitableChartArea = _chartArea;
            }
        }
    }

    //when there are many suitable areas, we take the first ones.
    if (_suitableAxisXtmp.Count > 0)
    {
        _suitableAxisX = _suitableAxisXtmp[0];
    }
    else
    {
        _suitableAxisX = null;
    }
    if (_suitableAxisYtmp.Count > 0)
    {
        _suitableAxisY = _suitableAxisYtmp[0];
    }
    else
    {
        _suitableAxisY = null;
    }

    return _suitableChartArea;
}
If there isn't any suitable chart area, then:
- we create a new one
- format it
- size its scale accordingly to the graph
Guid _guid = Guid.NewGuid();

if ((_chartAreaAxisX == null) || (_chartAreaAxisY == null))
{
    #region "one for showing the chart"
    _chartAreaChart = new ChartArea(Guid.NewGuid().ToString());
    this.FormatChartArea(_chartAreaChart);
    _chartAreaChart.Tag = new ChartAreaTagger(_guid, ChartAreaType.CHART, _color);
    _chartAreaChart.BackColor = Color.Transparent;
    _chartAreaChart.IsSameFontSizeForAllAxes = this.chart1.ChartAreas[0].IsSameFontSizeForAllAxes;
    this.chart1.ChartAreas.Add(_chartAreaChart);

    //format for chart (no labels)
    this.FormatAxis(_chartAreaChart.AxisX,
            _minX, _maxX,
            false, true, false);
    this.FormatAxis(_chartAreaChart.AxisY,
        _minY, _maxY,
        false, true, false);
    #endregion "one for showing the chart"
}
if (_chartAreaAxisX == null)
{
    #region "one for X axis"
    _chartAreaAxisX = new ChartArea(Guid.NewGuid().ToString());
    this.FormatChartArea(_chartAreaAxisX);
    _chartAreaAxisX.BackColor = Color.Transparent;
    _chartAreaAxisX.IsSameFontSizeForAllAxes = this.chart1.ChartAreas[0].IsSameFontSizeForAllAxes;
    _chartAreaAxisX.Tag = new ChartAreaTagger(_guid, ChartAreaType.AXIS_X, _color);
    _chartAreaAxisX.AxisX.LabelStyle.ForeColor = _color;
    this.chart1.ChartAreas.Add(_chartAreaAxisX);

    //format for X axis
    this.FormatAxis(_chartAreaAxisX.AxisX,
        _minX, _maxX,
        true, false, true);

    //this is dummy
    this.FormatAxis(_chartAreaAxisX.AxisY,
        _minY, _maxY,
        false, false, false);
    #endregion "one for X axis"
}
if (_chartAreaAxisY == null)
{
    #region "one for Y axis"
    _chartAreaAxisY = new ChartArea(Guid.NewGuid().ToString());
    this.FormatChartArea(_chartAreaAxisY);
    _chartAreaAxisY.BackColor = Color.Transparent;
    _chartAreaAxisY.IsSameFontSizeForAllAxes = this.chart1.ChartAreas[0].IsSameFontSizeForAllAxes;
    _chartAreaAxisY.Tag = new ChartAreaTagger(_guid, ChartAreaType.AXIS_Y, _color);
    _chartAreaAxisY.AxisY.LabelStyle.ForeColor = _color;
    this.chart1.ChartAreas.Add(_chartAreaAxisY);

    //this is dummy
    this.FormatAxis(_chartAreaAxisY.AxisX,
            _minX, _maxX,
            false, false, false);

    //format for Y axis
    this.FormatAxis(_chartAreaAxisY.AxisY,
        _minY, _maxY,
        true, false, true);
    #endregion "one for Y axis"
}
If we can find a chart area that matches our minimums and maximums (+/- defined percentage difference), then:
- we put our new chart onto it
- resize the scale of the found chart area so it can accept both graphs
#region "check minimums and maximums of the eventual existing charts"
IEnumerable<PointF>[] _functionsOnChartArea = this.GetFunctionsOnChartArea(_chartAreaChart);
foreach (IEnumerable<PointF> _functionTmp in _functionsOnChartArea)
{
    float _functionMinX = this.GetMinX(_functionTmp);
    if (_functionMinX < _minX)
    {
        _minX = _functionMinX;
    }

    float _functionMaxX = this.GetMaxX(_functionTmp);
    if (_functionMaxX > _maxX)
    {
        _maxX = _functionMaxX;
    }

    float _functionMinY = this.GetMinY(_functionTmp);
    if (_functionMinY < _minY)
    {
        _minY = _functionMinY;
    }

    float _functionMaxY = this.GetMaxY(_functionTmp);
    if (_functionMaxY > _maxY)
    {
        _maxY = _functionMaxY;
    }
}
#endregion "check minimums and maximums of the eventual existing charts"

#region "and adjust the axes accordingly, so they can take the old chart plus the newly added"
this.FormatAxis(_chartAreaAxisX.AxisX,
        _minX, _maxX,
        true, false, true);
this.FormatAxis(_chartAreaAxisX.AxisY,
    _minY, _maxY,
    false, false, false);

this.FormatAxis(_chartAreaAxisY.AxisX,
        _minX, _maxX,
        false, false, false);
this.FormatAxis(_chartAreaAxisY.AxisY,
    _minY, _maxY,
    true, false, true);

this.FormatAxis(_chartAreaChart.AxisX,
    _minX, _maxX,
    false, true, false);
this.FormatAxis(_chartAreaChart.AxisY,
    _minY, _maxY,
    false, true, false);
#endregion "and adjust the axes accordingly, so they can take the old chart plus the newly added"

#region "then draw our chart"
//set the color to transparent, because we don't want chart to be shown on this axis
this.DrawGraph(_chartAreaAxisX, _points, null, Color.Transparent);

//set the color to transparent, because we don't want chart to be shown on this axis
this.DrawGraph(_chartAreaAxisY, _points, null, Color.Transparent);

//finally, add the chart and draw it
this.DrawGraph(_chartAreaChart, _points, _legendTitle, _color);
#endregion "then draw our chart"
The mentioned procedures must be done for axis X, axis Y and the chart!
The graph can thus be drawn. We need to do a finally step - the layout.
Layout
Now, the most important part: the layout. The single most important thing is that the given graphs can have very different ranges, so we have to base everything on percentages.
To properly position additional axes, we have to take labels into account: for X axes, the label HEIGHT is important and for Y axes, the WIDTH is what matters. We thus compute our plot positions of the additional chart areas, each one offsetting by the labels size.
private void PerformChartLayout()
{
    if (this.chart1.Series.Count == 0)
    {
        //hide the base chart area
        this.chart1.ChartAreas[0].Visible = false;
    }
    else
    {
        //make the base chart area visible
        this.chart1.ChartAreas[0].Visible = true;

        //we must have a simple graph on our base series, otherwise the grid
        //would be hidden because of the MS chart's logic (but we make it transparent)
        if (!this.chart1.Series.Any(delegate (Series _series)
            {
                if (_series.ChartArea == this.chart1.ChartAreas[0].Name)
                {
                    return true;
                }
                else
                {
                    return false;
                }
            }))
        {
            //as we set our grid in percentages, the graph must be of suitable range
            this.DrawGraph(
                this.chart1.ChartAreas[0],
                new PointF[]
                {
            new PointF(1f, 1f),
            new PointF(100f, 100f)
                },
                null,
                Color.Transparent);
        }

        float _offsetX = 0;
        float _offsetY = 0;

        #region "position the chart plot positions with respect to label sizes"
        //we do this reversed, so the most recently added charts expand to outside
        foreach (ChartArea _chartArea in this.chart1.ChartAreas.Reverse())
        {
            //set the whole chart area position
            _chartArea.Position.FromRectangleF(this.ChartPosition);

            if (_chartArea.Tag is ChartAreaTagger)
            {
                ChartAreaTagger _chartAreaTagger = (ChartAreaTagger)_chartArea.Tag;

                if (_chartAreaTagger.ChartAreaType == ChartAreaType.AXIS_X)
                {
                    //set the size of the tick marks
                    _chartArea.AxisX.MajorTickMark.Size = this.TickMarkSizePercentageY;

                    //then measure the height of the labels
                    float _axisXLabelHeight = this.GetAxisXLabelHeightPercentage
                    	(_chartArea) + this.TickMarkSizePercentageY;

                    //and compute the position of the chart plot position
                    //based on the size of the label and the offset,
		    //which increases for every chart area
                    RectangleF _chartInnerPlotPosition = this.GetChartInnerPlotPosition();
                    _chartInnerPlotPosition.Y -= (_axisXLabelHeight + _offsetY);
                    _chartInnerPlotPosition.Height -= (_axisXLabelHeight + _offsetY);
                    _chartArea.InnerPlotPosition.FromRectangleF(_chartInnerPlotPosition);

                    //increase the offset!
                    _offsetY += _axisXLabelHeight;
                }
                else if (_chartAreaTagger.ChartAreaType == ChartAreaType.AXIS_Y)
                {
                    //set the size of the tick marks
                    _chartArea.AxisY.MajorTickMark.Size = this.TickMarkSizePercentageX;

                    //then measure the width of the labels
                    float _axisYLabelWidth = this.GetAxisYLabelWidthPercentage
                    	(_chartArea) + this.TickMarkSizePercentageX;

                    //and compute the position of the chart plot position
                    //based on the size of the label and the offset,
		    //which increases for every chart area
                    RectangleF _chartInnerPlotPosition = this.GetChartInnerPlotPosition();
                    _chartInnerPlotPosition.X += (_axisYLabelWidth + _offsetX);
                    _chartInnerPlotPosition.Width -= (_axisYLabelWidth + _offsetX);
                    _chartArea.InnerPlotPosition.FromRectangleF(_chartInnerPlotPosition);

                    //increase the offset!
                    _offsetX += _axisYLabelWidth;
                }
            }
        }
        #endregion "position the chart plot positions with respect to label sizes"

        //the chart areas are now positioned accordingly to the label sizes,
        //but this is not enough; we must position them also by the full offsets
        //(which we computed while positioning them),
        //so we just iterate through chart areas once again and use the computed offsets.
        //The areas will thus start from offset and not from zero.
        #region "position the areas with respect to the offset"
        foreach (ChartArea _chartArea in this.chart1.ChartAreas)
        {
            //set the whole chart area position
            _chartArea.Position.FromRectangleF(this.ChartPosition);

            if (_chartArea.Tag is ChartAreaTagger)
            {
                ChartAreaTagger _chartAreaTagger = (ChartAreaTagger)_chartArea.Tag;

                if (_chartAreaTagger.ChartAreaType == ChartAreaType.AXIS_X)
                {
                    //this moves to the right of the screen and decreases in width
                    RectangleF _chartInnerPlotPosition = _chartArea.InnerPlotPosition.ToRectangleF();
                    _chartInnerPlotPosition.X += _offsetX;
                    _chartInnerPlotPosition.Width -= _offsetX;
                    _chartArea.InnerPlotPosition.FromRectangleF(_chartInnerPlotPosition);
                }
                else if (_chartAreaTagger.ChartAreaType == ChartAreaType.AXIS_Y)
                {
                    //this doesn't move, but decreases in height
                    RectangleF _chartInnerPlotPosition = _chartArea.InnerPlotPosition.ToRectangleF();
                    _chartInnerPlotPosition.Height -= (_offsetY * 2);
                    _chartArea.InnerPlotPosition.FromRectangleF(_chartInnerPlotPosition);
                }
                else if (_chartAreaTagger.ChartAreaType == ChartAreaType.CHART)
                {
                    //this moves to the right of the screen
                    //(while not moving by Y), decreases in width and in height
                    RectangleF _chartInnerPlotPosition = this.GetChartInnerPlotPosition();
                    _chartInnerPlotPosition.X += _offsetX;
                    _chartInnerPlotPosition.Width -= _offsetX;
                    _chartInnerPlotPosition.Height -= (_offsetY * 2);
                    _chartArea.InnerPlotPosition.FromRectangleF(_chartInnerPlotPosition);
                }
            }
            else if (_chartArea == this.chart1.ChartAreas[0]) //don't forget the base chart area,
            	//which also must take the offset into account
            {
                //this does the same as the other CHART chart areas
                RectangleF _chartInnerPlotPosition = this.GetChartInnerPlotPosition();
                _chartInnerPlotPosition.X += _offsetX;
                _chartInnerPlotPosition.Width -= _offsetX;
                _chartInnerPlotPosition.Height -= (_offsetY * 2);
                this.chart1.ChartAreas[0].InnerPlotPosition.FromRectangleF(_chartInnerPlotPosition);
            }
        }
        #endregion "position the areas with respect to the offset"
    }
}
We used the PerformLayout() method for one more thing: we made sure that there is always a (transparent!) graph present on the base chart area, so the grid will be displayed.
Points of Interest
The Microsoft Chart control is not particularly suitable for such heavy customizations. The legend positioning must be better ironed out, but this could be quite difficult, because it is never clear when an internal chart element is set or not, so the sizes are uncertain.