I really like the NLog library and I use it pretty often in my projects. Some time ago, I wrote a post in which I showed you my preferred debug and production configuration. The other day, I presented you a simple layout renderer for assembly versions. Today, I would like to inform you that all those goodies ;) are available in my brand new LowLevelDesign.NLog.Ext Nuget package.
Additionally, you may find in it two ETW NLog targets. ETW (Event Tracing for Windows) is a very effective way of logging and its support in kernel makes it a great choice for verbose/trace/debug logs. Moreover, if you are using Windows Performance Toolkit in your performance analysis, providing your own ETW messages will help you correlate system events with methods in your application. ETW infrastructure is highly customizable (check Semantic Logging Application Block to see how your logs might look like and how they might be consumed:)).
Our first ETW NLog target is really simple, based on EventProvider from System.Diagnostics.Eventing:
using NLog;
using NLog.Targets;
using System;
using System.Diagnostics.Eventing;
namespace LowLevelDesign.NLog.Ext
{
[Target("EventTracing")]
public sealed class NLogEtwTarget : TargetWithLayout
{
private EventProvider provider;
private Guid providerId = Guid.NewGuid();
public String ProviderId {
get { return providerId.ToString(); }
set {
providerId = Guid.Parse(value);
}
}
protected override void InitializeTarget() {
base.InitializeTarget();
try {
provider = new EventProvider(providerId);
} catch (PlatformNotSupportedException) {
}
}
protected override void Write(LogEventInfo logEvent) {
if (provider == null || !provider.IsEnabled()) {
return;
}
byte t;
if (logEvent.Level == LogLevel.Debug || logEvent.Level == LogLevel.Trace) {
t = 5;
} else if (logEvent.Level == LogLevel.Info) {
t = 4;
} else if (logEvent.Level == LogLevel.Warn) {
t = 3;
} else if (logEvent.Level == LogLevel.Error) {
t = 2;
} else if (logEvent.Level == LogLevel.Fatal) {
t = 1;
} else {
t = 5;
}
provider.WriteMessageEvent(this.Layout.Render(logEvent), t, 0);
}
protected override void CloseTarget() {
base.CloseTarget();
provider.Dispose();
}
}
}
The second one is built on top of the Microsoft.Diagnostics.Tracing Nuget package (by Vance Morrison). Starting from .NET 4.5, the EventSource class is available in the framework, but if you want your code to work also with .NET 4.0 (as me), you need to use the Nuget package. The code of the extended ETW target is as follows:
using Microsoft.Diagnostics.Tracing;
using NLog;
using NLog.Targets;
using System;

namespace LowLevelDesign.NLog.Ext
{
    [Target("ExtendedEventTracing")]
    public sealed class NLogEtwExtendedTarget : TargetWithLayout
    {
        [EventSource(Name = "LowLevelDesign-NLogEtwSource")]
        public sealed class EtwLogger : EventSource
        {
            [Event(1, Level = EventLevel.Verbose)]
            public void Verbose(String LoggerName, String Message) {
                WriteEvent(1, LoggerName, Message);
            }

            [Event(2, Level = EventLevel.Informational)]
            public void Info(String LoggerName, String Message) {
                WriteEvent(2, LoggerName, Message);
            }

            [Event(3, Level = EventLevel.Warning)]
            public void Warn(String LoggerName, String Message) {
                WriteEvent(3, LoggerName, Message);
            }

            [Event(4, Level = EventLevel.Error)]
            public void Error(String LoggerName, String Message) {
                WriteEvent(4, LoggerName, Message);
            }

            [Event(5, Level = EventLevel.Critical)]
            public void Critical(String LoggerName, String Message) {
                WriteEvent(5, LoggerName, Message);
            }

            public readonly static EtwLogger Log = new EtwLogger();
        }

        protected override void Write(LogEventInfo logEvent)
        {
            if (!EtwLogger.Log.IsEnabled())
            {
                return;
            }
            if (logEvent.Level == LogLevel.Debug || logEvent.Level == LogLevel.Trace) {
                EtwLogger.Log.Verbose(logEvent.LoggerName, Layout.Render(logEvent));
            } else if (logEvent.Level == LogLevel.Info) {
                EtwLogger.Log.Info(logEvent.LoggerName, Layout.Render(logEvent));
            } else if (logEvent.Level == LogLevel.Warn) {
                EtwLogger.Log.Warn(logEvent.LoggerName, Layout.Render(logEvent));
            } else if (logEvent.Level == LogLevel.Error) {
                EtwLogger.Log.Error(logEvent.LoggerName, Layout.Render(logEvent));
            } else if (logEvent.Level == LogLevel.Fatal) {
                EtwLogger.Log.Critical(logEvent.LoggerName, Layout.Render(logEvent));
            }
        }
    }
}
The biggest difference between them is that the second one integrates much better with ETW infrastructure. Thanks to the dynamic manifest generation, events from the second target have more meaningful names and characteristics in tools such as PerfView or WPA:

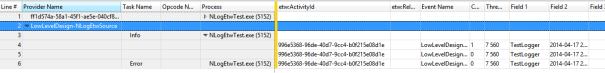
compared to events generated by the first target:
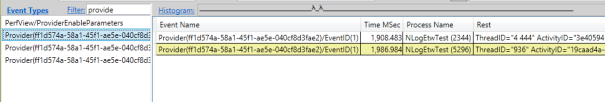

After examining the above output, there should be no doubt which target you should use. I recommend NLogEtwExtendedTarget except cases when you need control over GUID of your ETW provider. It’s impossible to change the GUID for LowLevelDesign-NLogEtwSource (EventSources use a well-defined, public mechanism (RFC 4122) for converting a name to a GUID) so logs from applications that use this target will always have the same provider. I don’t consider this a big problem as they are still distinguishable by process id or name.
There is one more thing that should attract your attention in the above screenshots. Have you noticed activity ids for our events? Yes, they are there and it is really easy to enable them. We used to call Trace.CorrelationManager.ActivityId = newActivityId; at the beginning of the activity scope, now we need to make one additional call: EventSource.SetCurrentThreadActivityId(newActivityId, out prevActivityId);. My test application looks as follows:
using System;
using System.Diagnostics;
using NLog;
using LowLevelDesign.NLog.Ext;
using Microsoft.Diagnostics.Tracing;

public static class TestNLog
{
    private static readonly Logger logger = LogManager.GetLogger("TestLogger");

    public static void Main(String[] args) {
        Guid prevActivityId;
        Guid newActivityId = Guid.NewGuid();
        Trace.CorrelationManager.ActivityId = newActivityId;
        EventSource.SetCurrentThreadActivityId(newActivityId, out prevActivityId);

        Console.WriteLine("Trace source logging");

        logger.Info("Start");

        Console.WriteLine("In the middle of tracing");

        logger.ErrorException("Error occurred", new Exception("TestException"));

        logger.Info("End");

        EventSource.SetCurrentThreadActivityId(prevActivityId);
        Trace.CorrelationManager.ActivityId = prevActivityId;
    }
}
UPDATE: @Scooletz with his comment inspired me to add a shortcut for scoping traces. The newly added class is named EtwContextScope and is available in version 1.2.1 of the package. The above Main method using it will look as follows:
public static void Main(String[] args)
{
    using (new EtwContextScope())
    {
        Console.WriteLine("Trace source logging");

        logger.Info("Start");

        Console.WriteLine("In the middle of tracing");

        logger.ErrorException("Error occurred", new Exception("TestException"));

        logger.Info("End");
    }
}
And its configuration file:
="1.0"
<configuration>
<configSections>
<section name="nlog" type="NLog.Config.ConfigSectionHandler, NLog" />
</configSections>
<startup>
<supportedRuntime version="v4.0" sku=".NETFramework,Version=v4.0" />
</startup>
<nlog internalLogToConsole="true"
internalLogLevel="Debug" throwExceptions="true">
<extensions>
<add prefix="lld" assembly="LowLevelDesign.NLog.Ext" />
</extensions>
<targets>
<target name="console" type="ColoredConsole"
layout="${longdate}|${uppercase:${level}}|${message}$
{onexception:|Exception occurred\:${exception:format=tostring}}" />
<target name="etw" type="lld.EventTracing"
providerId="ff1d574a-58a1-45f1-ae5e-040cf8d3fae2"
layout="${longdate}|${uppercase:${level}}|${message}$
{onexception:|Exception occurred\:${exception:format=tostring}}" />
<target name="eetw" type="lld.ExtendedEventTracing"
layout="${longdate}|${uppercase:${level}}|${message}$
{onexception:|Exception occurred\:${exception:format=tostring}}" />
</targets>
<rules>
<logger name="TestLogger" minlevel="Debug" writeTo="console" />
<logger name="TestLogger" minlevel="Debug" writeTo="etw" />
<logger name="TestLogger" minlevel="Debug" writeTo="eetw" />
</rules>
</nlog>
</configuration>
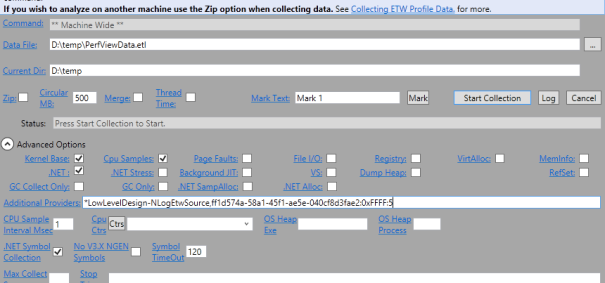
As ETW events are transferred via kernel buffers, you need to use special tools or libraries to collect them. You may either create your own solution with the help of the already mentioned Semantic Logging Block or try to use tools such as PerfView or WPR. The screenshot below shows you a PerfView capture window with enabled providers from my test application (notice that we can reference the extended ETW target only by its name):
If you are looking for information on how to use other tools or you want to know more about ETW tracing, I recommend a great Vance Morisson’s blog. If you happen to know Polish, have a look also at Michal’s post.
All source code from this post is available for download on my Codeplex page and my Nuget package waits for you here. :)
Filed under:
CodeProject,
Logging with NLog 


 General
  News
News  Suggestion
  Question
  Bug
Bug  Answer
  Joke
Joke  Praise
  Rant
Rant  Admin
Admin 


