In this final article in the series, we move from creating an Azure Synapse workspace to creating a streaming data pipeline and setting up a copying pipeline to save the streamed data to a dedicated SQL Pool.
After discussing Azure Synapse Analytics’ features and creating a workspace, we explored creating a dedicated SQL pool. Now, we need to populate this pool with data.
One of the most prominent features of Azure Synapse Analytics is its support for Spark. This support opens the possibility for processing real-time data and data streams using popular languages, such as Python, Scala, and SQL.
There are many ways to ingest and process streaming data in Azure Synapse Analytics, but we will focus on Spark Structured Streaming here. We will explore what it is, create a Spark pool, prepare our data, create a streaming pipeline and copy data pipeline, and explore our New York taxi data.
For this tutorial, you should have an Azure account, a workspace (which we created in the first article), and a dedicated SQL pool (which we created in the second article). It helps to be familiar with PySpark, but we’ll keep it simple.
What is Spark Structured Streaming?
Spark Structured Streaming is a stream processing engine built on top of the Spark SQL engine. It is scalable and fault-tolerant. It enables real-time data ingestion from various data sources — such as storage files, Azure Event Hubs, and more. Underneath, it uses customizable micro-batches to handle streaming data with as low as 1ms latency.
With Spark Structured Streaming, we can maintain logs and track any changes in the data source. It also enables us to build and deploy complete extract, transform, and load (ETL) pipelines with minimal code. Another noteworthy feature of Spark Structured Streaming is that its data frame APIs enable users to apply traditional SQL transformations.
Spark Structured Streaming works with Azure Synapse Spark pools. Before we start building the data stream, let us quickly familiarize ourselves with Spark pools.
What is a Spark Pool?
The Spark support in Azure Synapse Analytics has proven to be a great addition to its data exploration features. We can use Python, Scala, .NET, R, and more to explore and process data residing in Azure Synapse Analytics’ storage.
To get the most out of Spark, we need to create a Spark pool.
Creating a Spark Pool
We can create a Spark pool from the Azure portal or Azure Synapse Studio. Here, we will build our Spark pool from within Synapse Studio.
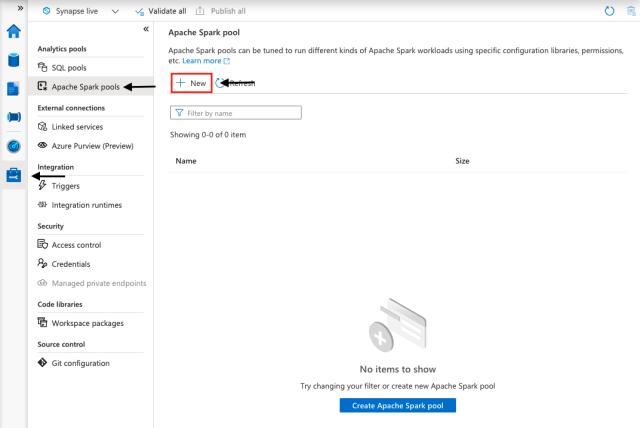
From Azure Synapse Studio, we go to the Manage tab and select Apache Spark pools. There is no pool available at the moment, so we’ll simply create one. The process is similar to how we created SQL pools earlier. First, click New.
Next, we name our Spark pool (TaxiFare) and choose basic settings. We select the node size (small, medium, large, extra-large, or extra-extra-large), enable or disable autoscaling, and select the number of nodes. We will have to make a tradeoff between budget and performance.

Next, we move on to Additional settings.
On this page, we can further customize our Spark pool. We can enable or disable automatic pausing and specify how long Spark should wait before shutting down the cluster when there is no active job.
We can also choose the Apache Spark version we want to use. At the time of writing this tutorial, Apache Spark 3.0 is still in preview.
We can also configure Apache Spark using a configuration file and specify any other additional pool properties.
For the sake of simplicity, we will use default settings for the rest of the fields. After reviewing the settings, we click Create.
After our Spark pool deploys successfully, we will be able to see it under Apache Spark pools.
With our Spark pool in place, let’s now start building our data stream.
Preparing Sample Data
As we mentioned earlier, Spark Structured Streaming enables users to read data as a stream from specified storage files. Here, we will generate some data using open-source NYC Taxi & Limousine Commission - yellow taxi trip records from Microsoft. We will build a streaming pipeline to load and process data and write it back to another storage location.
We use PySpark in this article, so it is beneficial to be familiar with the PySpark development environment. We will keep things simple and easy to follow along, though.
Creating a PySpark Notebook and Loading Data
To start preparing our sample data, we first create a PySpark notebook. We go to Azure Synapse Studio, go to the Develop tab, and click + and Notebook to create a new PySpark notebook.
Before we run any notebook cells, we must attach our notebook to a Spark pool. We must also ensure we select PySpark (Python) as the language.
Next, we attach our notebook to our previously created Spark pool. Now, we are ready to proceed with the development.
Let’s start by importing the required functions and dataset. We will create the data from the NycTlcYellow library and display the first ten entries of the data frame:
# importing dataset and functions
from azureml.opendatasets import NycTlcYellow
from pyspark.sql.functions import *

data = NycTlcYellow()
# converting the data to data frame
df = data.to_spark_dataframe()
# Display 10 rows
display(df.limit(10))
Let us also look at its schema:
# Display schema
Df.printSchema()
Here, it is helpful to know the total count of entries. We use this information to decide if we can use this dataset for streaming purposes.
df.count()
The data has nearly 53 million rows, which is enough data. It would take some time to write it to another location, so creating a data stream is a better option. Let us play with this data and see if we can apply some transformations to it.
Transforming the Data
The data contains many unnecessary rows that do not interest us. We just want to know the duration of the trip and how much it cost. For that, we will only need a few columns: tpepPickupDateTime, tpepDropoffDateTime, and fareAmount.
We can either drop the rest of the columns or just select the ones we need, as follows:
df = df.select(col("vendorID"),col("tpepPickupDateTime"),col("tpepDropoffDateTime"),col("fareAmount"))
What if we’re interested in knowing how much a trip cost on a particular day? Since we already have the pickup and drop-off time and date, we can use that information to get the date. Let’s see how we can do that.
First, create a date column as follows:
df = df.withColumn("Date", (col("tpepPickupDateTime").cast("date")))
In the above line of code, we cast the tpepPickupDateTime column to a date datatype.
In the next step, we want to derive new columns (year and month) from that column since it will make it easier for us to aggregate later:
# Derive different columns from casted date column
aggdf = df.withColumn("year", year(col("date"))) .withColumn("month", month(col("date"))) .withColumn("day", dayofmonth(col("date"))) .withColumn("hour", hour(col("date")))
We can save this data to any underlying storage:
# Saving data as csv file
df.repartition(1).write.option("header","true").csv("/Synapse/Streaming/csv/processsed.csv")
Besides traditional file storage formats like CSV and Parquet, Azure Synapse Analytics also supports data storage in the Delta format. We can choose any of these formats to store data, but Delta offers more flexibility with an additional layer of advanced features.
Use this code to store the transformed data in Delta format:
delta_path='/Synapse/Streaming/Processed/NyTaxiFare'
df.write.format('delta').save(delta_path)
Building a Streaming Pipeline
We’re interested in streaming then reading data from a storage location. When the application is reading data, we can process and transform the data then write it back to another storage location.
The below code reads the data we just stored in a streaming fashion, renames a column, calculates the trip duration, and saves the selected columns back to a specified storage space.
# path to store back the data
delta_processed='/Synapse/Streaming/Processed/NYTaxiFare'
# path to store the checkpoint to keep the logs
delta_checkpoint='/Synapse/Streaming/Processed/NYTaxiFareCheckpoint'

# read the previously stored data in streaming manner
streaming_data=(spark.readStream.format('delta').load(delta_path)
# rename the column
.withColumnRenamed('fareAmount','tripCost')
# Calculate the trip duration in minutes using drop off and pickup time
.withColumn('TripDuration',round((col('tpepDropoffDatetime').cast('float')-col('tpepPickupDatetime').cast('float'))/60))
.selectExpr('Date','TripDuration','tripCost')
.writeStream.format('delta')
.option('mode','overwrite')
.option('checkpointLocation',delta_checkpoint)
.start(delta_processed))
Although our data consists of millions of rows, the query execution is fast because Spark keeps running the stream in the background asynchronously. There are a couple of ways to check if our stream is still running:
# isActive should return true if stream is running
print(streaming_data.isActive)
# Checking the status of the data stream.
print(streaming_data.status)
Azure Synapse Analytics also enables us to create a Delta Lake table on top of streaming data. We use the following code to save the data to a Delta Lake table:
%%sql
CREATE TABLE NewyorkTaxiFaree
USING DELTA
LOCATION '/Synapse/Streaming/Processed/NYTaxiFare'
Here, we can fully leverage the SQL command to query data from the table:
%%sql
select * from NewyorkTaxiFaree limit 100
%%sql
select * from NewyorkTaxiFaree WHERE tripCost < 10
We can also load the Spark SQL table data to a DataFrame and display it to confirm it loaded:
# Load the data into SQL Pool
result = spark.sql("SELECT TripDuration, tripCost FROM NewyorkTaxiFare")
# display the loaded data
display(result)
Creating a Copy Data Pipeline
Our data is in place, but what if we want to copy data to SQL pools? Azure Synapse Analytics has us covered here. It enables us to create a data pipeline that can copy data from underlying storage to an SQL pool.
To create the copy pipeline, we first go to Synapse Studio. We go to the Integrate tab and click + and Copy Data tool to create a Copy Data pipeline.
On the next screen, we name our pipeline "CopyDataToSQLPool" and add a task description if we like. We can also choose to run the task once, schedule it, or set up a tumbling window trigger. For this article, we will run it once.
We stored our data in the workspace’s default storage, so we choose that as our data source.
In the next tab, we select the file we want to load. Here, we can choose CSV, Parquet, or any other supported file storage format. We will upload the processed Delta files.
On the next tab, we choose the destination datastore (NYTaxiFare).
We want to move the data to a dedicated SQL pool, so we’ll choose that.
We now click Use Existing Table, choose the table we previously created, then move to the next tab.
Next, we select the table we want to load from among the options.
On the next tab, we will find the mappings for table columns. We need to map columns correctly, so we review the mapping carefully. We must fix any issues before running the pipeline, or we’ll have to deal with the chaos later.
We now select any other settings we want to apply, for example, fault tolerance or logging, then click Next >.
Next, we review and finish the pipeline, then click Next >.
We now deploy the pipeline. When the deployment is successful, we are ready to finish up and run the pipeline. To do this, we click Finish.
When the pipeline runs successfully, the data loads into the respective table.
We can query the SQL pool to verify the pipeline has transferred the data successfully.
Note that we should ensure we have the necessary read and write permissions. Otherwise, we are likely to run into a FailedDbOperation error:
Operation on target Copy_vw4 failed: ErrorCode=FailedDbOperation,'Type=Microsoft.DataTransfer.Common.Shared.HybridDeliveryException,Message=Please make sure SQL DW has access to ADLS Gen2
Moreover, our firewall should allow Azure services and resources to access the Synapse workspace. We can edit our firewall settings in the Azure portal. From our workspace, we click show firewall settings.
Once there, we turn on the permission.
Next Steps
In this series of articles, we introduced you to Azure Synapse Analytics and some of its best features. We focused on streaming analysis using Azure Synapse Analytics, from creating an Azure Synapse workspace to creating a streaming data pipeline and setting up a copying pipeline to save the streamed data to a dedicated SQL Pool.
We learned how to leverage Azure Synapse Analytics to do all this. But this is just the beginning. Once our data is in a dedicated SQL Pool, we can create interactive dashboards to analyze the data. We can also connect our data with Azure Machine Learning, Microsoft Power BI, and many third-party services and integrations to help us with Big Data analysis. Use your Azure subscription and free credits to explore these features.
To learn more, register today to view the Hands-on Training Series for Azure Synapse Analytics.
C# Corner MVP, UGRAD alumni, student, programmer and an author.


