In this article, we explain how to design and analyze the parallelism in such an application using Intel® Advisor’s Flow Graph Analyzer (FGA), a tool from Intel that supports parallel applications using the Intel® Threading Building Blocks (Intel® TBB) flow graph interface.
The advanced driver assistance systems (ADAS) and autonomous driving technologies deployed in modern cars rely on environmental awareness through sensors such as radar, LIDAR, and cameras. The underlying machine learning or deep learning algorithms that provide this awareness are compute-intensive―and become even more demanding as the sensor resolution grows. For example, detection and classification of objects in a video stream requires inspection of every frame for objects of interest at all possible aspect ratios and sizes. A real-time object detection system also demands a lot of compute resources. And the demand only increases as we approach near-perfect systems.
These systems often involve a process of proposal generation (i.e., they propose and then analyze potential regions of interest in an image). Fortunately, proposal generation is repetitive and can be parallelized to improve performance. The expressed parallelism is scalable, since proposal generation can include the entire image as a single proposal all the way down to each pixel in a frame as a separate proposal. Since there are no dependencies among the processing of proposals, they can be processed in batches as system resources allow, and as they become available (i.e., in a pipeline fashion).
In this article, we explain how to design and analyze the parallelism in such an application using Intel® Advisor’s Flow Graph Analyzer (FGA), a tool from Intel that supports parallel applications using the Intel® Threading Building Blocks (Intel® TBB) flow graph interface. Intel TBB is a widely used C++ template library that enables developers to easily create parallel applications to take advantage of multicore architectures and heterogeneous systems. The flow graph interface was introduced in Intel TBB in 2011 to exploit parallelism at higher levels by providing efficient implementations of dependency graphs and data flow algorithms. [Editor’s note: "Intel® Threading Building Blocks Celebrates 10 Years," in The Parallel Universe special issue, includes several interesting articles on the evolution and future directions of the Intel TBB API.]
Even though Intel TBB makes it easier to express parallelism, ADAS and autonomous driving applications are complicated and may contain many interconnected algorithms and layers of parallelism―making them challenging to both design and tune. FGA, now available as a technology preview feature in Intel Advisor, makes this task more manageable. We’ll discuss how to use FGA’s features as we go through the analysis of an OpenCV*-based autonomous driving example that is implemented using the Intel TBB flow graph API.
The Advanced Driver Assist Example
We’ll use a demo framework for an ADAS as a running example. Our example framework supports two modes of operation:
- Online mode, where the framework receives a live feed from the camera sensor mounted on the rearview mirror and captures data from the front of the car.
- Offline mode, where recorded frames are read from a file to simulate the camera sensor functionality.
Incoming compressed camera frames are decoded and forwarded to a video input processing module that performs post-processing of the frames to ensure they are ready to be consumed by the computer vision algorithms.
The post-processed data is then broadcast to the registered computer vision use-cases in the framework (e.g., object recognition, lane departure warning, front collision warning). These use-cases can be executed independently (in parallel) on the same frame. And many of them internally use a process of proposal generation that allows for parallelization at the use-case level as well. Often, the use-cases are implemented using OpenCV* algorithms that already contain loop-level parallelism. We therefore have a framework with multiple levels of parallelism. The framework is extensible, since it allows new algorithms to be registered through plugins. The computer vision algorithms operate on the decompressed frames and produce metadata associated with detected objects/lanes and alerts for lane departure and front collision warnings. A combined module fuses all the information together and overlays it on top of the decompressed frame, which is then rendered for display, as shown in the colored highlights of Figure 1. The smaller grayscale images at the top highlight the output of each use-case.
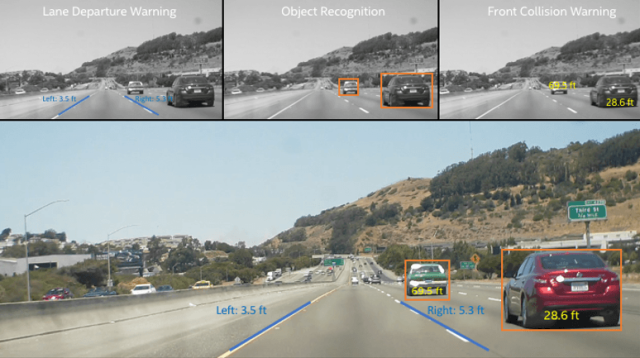
Figure 1. ADAS application example
Evolution of the Parallel Framework
In general, a key performance indicator for a video processing application is the frame completion rate, which means how many frames are completed if there is a fixed time budget for completing each frame. If the processing of a frame exceeds the budget, it’s dropped. So a completion rate of 70 percent for a 24 ms deadline means that 70 percent of frames can be completed given this deadline, while 30 percent must be dropped.
We examined three implementations during our optimization of this framework:
- The original serial/native implementation
- A parallel/native implementation
- An Intel TBB flow graph implementation
Figure 2 shows the frame completion rates for these three implementations, demonstrating that shorter deadlines become feasible as optimizations are applied.

Figure 2. Comparison of frame completion rates
The serial/native implementation executes the use-cases in a serial fashion on a multi-core processor. Many of the use-cases are implemented using OpenCV, and even though they may contain nested, loop–level parallelism, this approach results in poor utilization of the cores in the system. The exposed parallelism of the individual algorithms is limited, which directly impacts the scalability of the application.
The parallel-native implementation was task-based, allowing concurrent execution of algorithm modules using standard threads. However, this causes oversubscription because threads are being created for the tasks in addition to the Intel TBB threads created within OpenCV. To have a truly flexible and extensible framework that avoids oversubscription, the flow graph implementation uses Intel TBB at both levels.
Figure 3 shows the advanced driver assist framework implemented as an Intel TBB data flow graph. Execution starts with a standard flow graph function node (Init) which encapsulates an initial setup routine that is applied to each frame. Subsequently, interaction with an external activity, the actual decoding of each frame, is expressed through an asynchronous node (Decode). The video input processing (VIP) node broadcasts the input image to each use-case (i.e., object recognition, lane departure warning, front collision warning) and a multifunction node (Copy). This node performs two actions:
- Stores the unmodified input image for a later merge with the output of the use-cases.
- Generates a token for each use-case.
The next node generates a tuple of this token and the output buffer, which is subsequently consumed by the multifunction Combine node. The highlights in Figure 1 are outputs from the different use-cases represented by flow graph composite nodes in the center of Figure 3. In our example, object recognition (OR), lane departure warning (LDW), and front collision warning (FCW) are implemented using OpenCV. The Display node in our graph displays the output image. [Editor’s note: The full graph node attributes are beyond the scope of this article. See the Intel® Threading Building Blocks Flow Graph documentation for API details.]
Figure 3. Graph depicting the autonomous driving example framework
The major advantage of our data flow design is that more parallelism can be expressed, which improves performance. Also, our implementation doesn’t require any modification of the existing use-cases, since they can be represented as single grouped function of nodes that just invoke their process_frame() function. That way, the flow graph implementation is backwards-compatible to all existing framework plugins.
Next, we’ll analyze the performance of this flow graph using the features available in the Intel FGA tool to understand more about its behavior and discover that while it currently outperforms previous implementations, there is still room for improvement.
Overview of Intel FGA
Figure 4 shows Intel FGA visualizing a graph and its associated performance trace data. The tool has five viewing areas:
Figure 4. Intel FGA showing a captured graph and associated trace data
- Menu/Toolbar area: Exposes the operations for designing, manipulating, visualizing, and analyzing graphs.
- Index area, divided into three categories. Designer mode shows available node types for building new graphs. Hierarchical View represents the graph topology as a hierarchical tree. And Analysis mode (Figure 4) represents graph performance as squares in a tree map. (In this article, we focus on the Analysis mode.)
- Canvas area: This is the primary graph viewing area where graphs can be constructed or displayed. This area supports common editing operations to facilitate the design of new graphs.
- Reports area: This houses all basic reports such as graph and node properties and reports that are generated by analytics, such as semantic rule checks and critical path algorithms.
- Chart area: This area displays performance statistics and execution trace timeline charts for graphs that have associated trace data. This data is automatically captured by the trace collector, which can be invoked from the GUI or as a command-line utility.
In Intel FGA, the viewing areas and modes can be used to create two main workflows for design and analysis:
- The design workflow uses a drag-and-drop paradigm for interactively constructing Intel TBB flow graphs.
- The analysis workflow captures performance data from Intel flow graph applications.
The tool provides the ability to visualize and interact with the performance data. We use this analysis workflow to examine the performance data collected for our ADAS example.
Performance Analysis of the ADAS Example
To optimize the performance of our example, we first need to identify the bottlenecks. Intel FGA allows developers to capture the graph topology and task execution traces from running Intel TBB flow graph applications. Figure 5 shows the trace collection dialog window that allows users to specify the application to trace. When data collection is finished, two files are generated:
- GraphML file describing the topology of the graph that was just executed
- TraceML file with the task execution traces from the graph
Finding the Most Important Parts of the Application
A common first step in analyzing application performance is identifying where the majority of the time is spent in an application. Intel FGA has two features to assist with this step.
Figure 5. Intel FGA trace collection dialog
First, the tree-map view shows the total CPU time represented as a large rectangle that is subdivided into smaller rectangles representing the nodes in the graph. The area of the nodes is proportional to the total CPU time consumed by the node. Colors reflect the concurrency observed when the node was executing (red means low concurrency). Figure 6 shows the tree-map view of our ADAS example. From this figure, we can conclude that the use-cases require different amounts of time to compute and that OR dominates the CPU time of the framework. The differences in execution times for the use-cases supports our decision to allow each use-case to send its results to the overlay node independently. Any kind of barrier might create a load imbalance.
Intel FGA can also calculate the critical path through an application and project it onto the flow graph’s topology. This second view is shown in Figure 7. The critical path for our ADAS example highlights the key set of nodes to consider for optimization. From the combination of tree map and critical path views, we now know that not only is OR the most time-consuming node individually, it also lies on the most important path through the application. The performance of the graph is therefore limited by the performance of OR, so it should be our highest priority for optimization. Sometimes, it may be necessary to determine which algorithms are candidates for offloading to accelerators to meet a strict performance specification.
Figure 6. Tree-map view
Figure 7. Screenshot showing the critical path of a graph
Analyzing the Performance Characteristics of the Bottleneck
Now that we’ve identified that OR is the most important algorithm, we can further inspect its performance by looking at the timeline views in Intel FGA. The over-time task data grouped by thread provides the raw view of the collected traces. In this chart, we can see tasks executed by each thread and their duration. Figure 8 shows the zoomed-in view of the data for one frame of processing and the legend describing the colors. The tasks are colored based on the type of task. Graph tasks are colored based on the task duration, with a lighter color used to highlight tasks that are small relative to the cost of scheduling a task. Nested parallel tasks and asynchronous tasks are shown in blue.
Figure 8. Over-time trace charts showing one frame of data and the associated color legend
The graph task colors are quantized using a gradient that ranges from 1µs to 1ms so developers can identify tasks (hence nodes) that have execution times that are on the lower end and may be affecting performance scaling. Selecting a task in the timeline highlights the node in the graph on the canvas. This chart allows us to focus on the tasks that are too small to be spawned on a thread and enables us to debug the performance of the graph when we see low concurrency. Similar information is available for the tasks spawned from nested parallel algorithms.
From Figure 8, we see that while threads are busy at times during OR, there is still room for improvement. The blue tasks indicate that there is nested parallelism that uses Intel TBB, but the black regions indicate times during which the cores are idle. Since OR is the dominant computation in our example, we may want to see which tasks correspond to it. All tasks are shown in Figure 8. If we want to focus only on the tasks that fall on the critical path, we can use selection-based highlighting to show tasks on the critical path.
Figure 9 shows the timeline view when only tasks related to the critical path are highlighted. Note that displaying nested tasks is currently an experimental feature of Intel FGA that requires manual instrumentation. From this figure, we can see that the majority of the tasks in the timeline can be mapped to the OR node. The core idle times, indicated by the black regions, can be addressed by shrinking the time taken to compute OR, thereby eliminating the idle time or by scheduling additional algorithms that could execute in parallel and keep the idle cores busy.
Figure 9. Critical path shown on the execution traces
Let’s inspect the OR node execution traces for the frame shown in Figure 9. Zooming into this frame reveals four nested parallel algorithms executed by the OR node in this frame (Figure 10). Additional information is presented for the parallel algorithms to help us determine if these algorithms are executing efficiently. The Statistics view has per-node data presented as a table that shows the performance statistics of each node at the graph level. In our analysis of the OR node, we’re more interested in the algorithms that are executed in each node. Figure 10 shows the per-algorithm data for the four parallel algorithms that were executed in our selected frame. We can see that the efficiencies of OR::tbb149 and OR::tbb213 are reasonably high and require less performance tuning. OR::tbb261 and OR::tbb284, on the other hand, exhibit poor efficiency, possibly because of the small number of tasks executed by these algorithms. This could result in load imbalances that reduce parallel efficiency and scalability.
Figure 10. Graph statistics table showing algorithm statistics for OR::tbb149, OR::tbb213, OR::tbb261, and OR::tbb284
Since Intel TBB uses work-stealing to schedule tasks, we may also be interested in seeing which threads execute particular nodes. It is easy to see this in Intel FGA by switching to a per-node view of the timeline (Figure 11). We can now see that the OR node is often executed by the same thread (colored green), but that at times other threads execute it.
Figure 11. Tasks grouped by nodes
In addition to the timeline, algorithm statistics, and graph topology views, we can also view per-node data in tabular form (Figure 12). This allows developers to sort the data and determine the best regions for optimization. Selecting a row will highlight the corresponding node in the graph view.
Figure 12. Graph Statistics table showing per-node statistics
Conclusions
Intel FGA gives developers a comprehensive set of tools to examine, debug, and analyze Intel TBB flow graphs. Applying it to our ADAS example application, we were able to quickly identify the most important nodes for optimization. We were also able to determine that while there was some use of nested parallelism in the OR use-case, there are still idle cores that we may be able to use to find additional parallelism.
Software and workloads used in performance tests may have been optimized for performance only on Intel microprocessors. Performance tests, such as SYSmark and MobileMark, are measured using specific computer systems, components, software, operations and functions. Any change to any of those factors may cause the results to vary. You should consult other information and performance tests to assist you in fully evaluating your contemplated purchases, including the performance of that product when combined with other products. For more complete information visit http://www.intel.com/performance.
Intel’s compilers may or may not optimize to the same degree for non-Intel microprocessors for optimizations that are not unique to Intel microprocessors. These optimizations include SSE2, SSE3, and SSSE3 instruction sets and other optimizations. Intel does not guarantee the availability, functionality, or effectiveness of any optimization on microprocessors not manufactured by Intel. Microprocessor-dependent optimizations in this product are intended for use with Intel microprocessors. Certain optimizations not specific to Intel microarchitecture are reserved for Intel microprocessors. Please refer to the applicable product User and Reference Guides for more information regarding the specific instruction sets covered by this notice.
You may know us for our processors. But we do so much more. Intel invents at the boundaries of technology to make amazing experiences possible for business and society, and for every person on Earth.
Harnessing the capability of the cloud, the ubiquity of the Internet of Things, the latest advances in memory and programmable solutions, and the promise of always-on 5G connectivity, Intel is disrupting industries and solving global challenges. Leading on policy, diversity, inclusion, education and sustainability, we create value for our stockholders, customers and society.


