Introduction
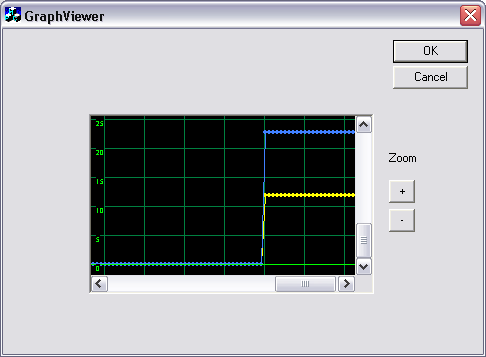
While working with a Process Control System, I needed to plot various output variables in real time. As Windows Task Manager History is very elegant to me, it has been my inspiration, and I added zooming capability and tooltips message to make it fancier.
Background
I want to give credits to article authors for their articles I used to accomplish this work.
Using the Code
The main class GraphWnd is derived from CWnd so that it can have a standard MFC control signature.
class GraphWnd : public CWnd
You have to plan ahead how many parameters you want to plot and choose their colors on the plots by adding different colors from a predefined enum into a vector while being passed to a GraphWnd class construction.
enum eColor     {
         SOLID_RED,
         LIGHT_RED,
         SOLID_YELLOW,
         LIGHT_YELLOW,
         SOLID_GREEN,
         LIGHT_GREEN,
         SOLID_BLUE,
         LIGHT_BLUE,
         SOLID_BLACK,
         LIGHT_BLACK,
         SOLID_MAGENTA,
         LIGHT_MAGENTA,
         SOLID_CYAN,
         LIGHT_CYAN,
         SOLID_WHITE};
...
GraphWnd(CRect rect,
CWnd* parent,
vector<ecolor> color)
The parameters plotting is done through the UpdateGraphe method.
void UpdateGraphe(GraphData<double> data,
double timeUnit,
double valueUnit,
double minValue,
double maxValue,
string message)
- The structure
GraphData<t> data is used to handle the display of as many as parameters you wish.
template<T> struct GraphData
{
    std::vector<T> d;
};
The plot axis are time axes as X axis and values axis as Y axis.
double timeUnit is the grid width in pixel on the X axis.double valueUnit is the grid height in pixel on the Y axis.double minValue is the minimum value expected on the Y axis.double maxValue is the maximum value expected on the Y axis.string message is a tooltip message.
That's all, folks. Please vote after using my article.
History


 General
  News
News  Suggestion
  Question
  Bug
Bug  Answer
  Joke
Joke  Praise
  Rant
Rant  Admin
Admin 


