Introduction
Web services are the fundamental building blocks that expose useful functionality to Web users through a standard web protocol called Simple Object Access Protocol (SOAP). These services are registered so that users can find them easily through Universal Discovery Description and Integration (UDDI). Applications that run on the .NET platform extensively use web services to expose the business functionality and it's very important to measure the performance when a client sends request to a web service. This article gives an idea of how to identify the performance of web method calls by using the NETMon tool.
Network Monitor is a component of Microsoft Systems Management Server (SMS) used to detect and troubleshoot problems on the network. Network traffic is saved in a proprietary capture file, so that the captured data can be analyzed later. If NetMon is not installed in your system, follow the steps below to install NetMon.
Installation Steps
- Open Control Panel. Add/Remove Programs.
- Click on Add/Remove Windows Components.
- In the Windows Component Wizard, select the Management and Monitoring tools. Click on Details. Select “Network Monitor Tools”. Click on “OK”.
- To start installation, click Next.
- Click on Finish to complete the installation.
After installing the NetMon tool, the next step is to monitor the web method call and identify the performance, which is explained below:
Guidelines to Measure the Performance of a Web Service
-
Identify a Web Service for which you want to find the performance. Open NetMon on the machine where the web service resides. (Path for NetMon is C:\Winnt\system32\Netmon\netmon.exe). First time when the NetMon is opened, a “Select a network” window is displayed. Select Local Area Connection (LAN) and click OK. If you want to capture data on another network, click on “Capture” menu items -> Networks.
-
Set the buffer settings to a bigger value so that the captured data will not be lost. To do this, click on “Capture” menu items -> Buffer Settings. The “Capture Buffer Settings” window is opened. Set the buffer and frame size and click on OK to save the values.
-
To capture the network packets, select capture menu -> start or click on the “Start Capture” button on the tool bar. It starts capturing the packets that are coming to and going from the machine.
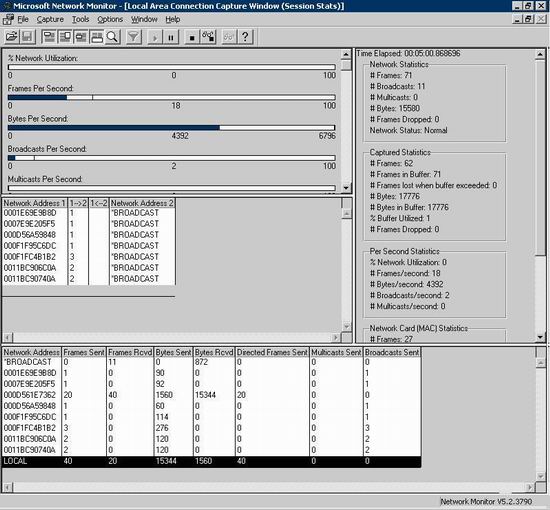
Snapshot 1: NetMon when capturing the packets
Note: When the incoming and outgoing packets to a machine are very high, then the tool may skip some of the packets. To avoid this, click on “Capture” and then select “Dedicated capture mode”.
-
Send a request from a client which consumes this web service. Wait until you get the response to the client and then stop NetMon. To stop capturing, click on Capture menu -> “stop and view”, or “stop and view” button on tool bar.

Snapshot 2: The captured data on a machine
-
Filtering of captured data: NetMon captures all the packets going to and from a machine. To ease the process of finding out the data relevant to this web service, there is an option to filter the captured data. To filter the captured data, click on “Display” menu -> “Filter”, or click on the “Filter” button on the tool bar. The display filter window appears.
Snapshot 3: Filters window
-
The filters can be set on three parameters like Protocol, Addresses and the properties using the expressions available as shown in snapshot 3.
-
“Post request from client” in the captured data indicates the request. “Response to client” in the captured data indicates the response back to the client. A packet, for example, is the frame with “Post request from client” till the next frame with “Post request from client”.
-
Calculation of time taken by the web service: The difference in time taken for the first packet to the last packet is the total transmission time. The difference in time for the last packet in the request and the first packet sent for the response is the time taken for the web service processing.
Additional Features of NetMon:
-
In order to easily identify the requests coming from a machine, NetMon provides you a feature to resolve the IP addresses into names. To achieve this, click on “Capture” menu -> Addresses. The “Address database” window is displayed.
Snapshot 4: Resolution of addresses to names
-
There is an option to insert a comment frame in between the captured data, for ease. Click on “Tools” menu in the captured data and then select “Insert Comment Frame”.
-
The detailed information about the frame can be seen by double clicking a frame as shown in snapshot 5.
Snapshot 5: The frame in detail
Note: If the web service contacts a database for its processing, then the tool provided by SQL Server, i.e., profiler, can be used to find out the time taken by the database.
License
This article has no explicit license attached to it, but may contain usage terms in the article text or the download files themselves. If in doubt, please contact the author via the discussion board below.
A list of licenses authors might use can be found here.
This member has not yet provided a Biography. Assume it's interesting and varied, and probably something to do with programming.


