In this article, we can see in detail how to create a simple SPC (Statistical Process Control) CP, CPK Chart using C#.
Introduction
In this article, we can see in detail how to create a simple SPC (Statistical Process Control) CP, CPK Chart.
I have been working on several automation projects. Nowadays, automobile industry is interested in automated measuring machines to ensure quality and to compete in the global industry. The main part of any automation software is to get the accurate result with Quality check, for this purpose, we use the SPC (Statistical Process Control) to find the quality result.
You can also view my previous articles related to Factory Automation like:
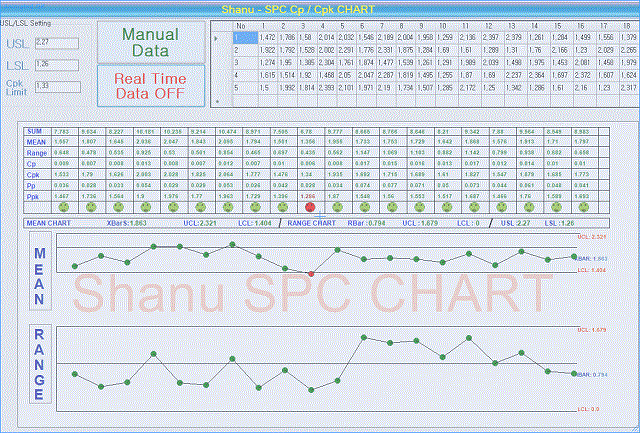
Capability is to get the continuous data from any part and compare the result with Cp, Cpk, Pp and Ppk. Where Cp, Cpk are Process Capability and Pp, Ppk are process performance. Let’s consider one of my real time projects, which is using in a Manufacturing Automation Measuring machines. Let’s consider now Camshaft, Crankshaft or any part of Car Engine which need to be checked with Quality control. The check part will be measured using some kind for Sensors, for example, in our project, we use a digital sensor for measuring Camshaft and Crankshaft. Using the sensor, we get continuous data and the real time data will be checked with SPC Cp, Cpk, Pp and Ppk charts. Display the final output to the operator and to the Quality control Engineer. Here is my real time project screen. All the Measurement data has been received from the Digital Sensor.

I have hidden the SPC Cp, Cpk, Pp and Ppk chart as we used some third party chart control at that time. For the SPC chart in the market, there are very few third party chart controls available and there is no any free chart for SPC Cp, Cpk, Pp and Ppk. I thought of creating a simple SPC Cp, Cpk, Pp and Ppk chart. As a result, after a long study about SPC and all its functionality, I have created a simple SPC Cp, Cpk, Pp and Ppk chart. Hope you all will like it.
I created the SPC chart as a User Control. You can just add my User Control DLL to the project and use it.
Shanu CpCpkChart User Control Features
- Display chart with Sum, Mean and Range values
- Cp, Cpk, Pp, Ppk with alert result text warning with Red for NG and green for OK result
- Mean (XBAR) and Range (RBAR) chart with Alert image with Red for NG and green for OK result
- Automatic Calculate and display UCL(Upper Control Limit), LCL(Lower Control Limit) Value with both XBAR and RBAR value
- Save Chart as Image (Note to save the Chart image double click the chart or right click and save as Image).
- Real Time data Gathering and display in the Chart
- User can add Chart Watermark text
First, let’s see what is Cp and Cpk.
Cp and Cpk -> Process Capability
- Cp - measures how well the data fits within the spec limits (USL, LSL)
- Cpk - measures how centered the data is between the spec limits
Cp, Cpk Formula
Cp=(USL-LSL/6SIGMA) -> USL-LSL/6*RBAR/d2
Cpk=min(USL-XBAR/3Sigma,LSL-XBAR/3Sigma)
Pp and Ppk -> Process Performance
- Pp - measures how well the data fits within the spec limits (USL, LSL)
- Ppk - measures how centered the data is between the spec limits
Pp, Ppk Formula
Pp=(USL-LSL/6SIGMA) -> USL-LSL/6 STDEV

Ppk=min(USL-XBAR/3STDEV,LSL-XBAR/3STDEV)
Reference Websites
Now let’s see how I have created a SPC Cp, Cpk chart. My main aim is to make a very simple SPC Chart which can be used by the end users.
I have created a SPC Cp, Cpk Chart as a User Control so that it can be used easily in all projects.
I have attached a zip file named as ShanuSPCCpCpkChart.zip which you can download from the link at the top of this article. It contains my SPC chart user control source and a demo program.
- "ShanuCPCPKChart.dll": You can use this user controls in your project and pass the data as
DataTable to userControl.
In the user control, I will get the DataTable value and calculate the result to display as:
SumMeanRangeCpCpkPpPpk
Bind all the results to the chart with smiley alert image. If the data is good, then display the green smiley and if the data is NG(Not Good). Using the mean and Range values, I will plot the result as Mean and Range chart with Alert Image.
User can pass the USL (upper Specification Limit), LSL (lower Specification Limit) Cpk Limit values to the ShanuCPCPKChart user control. Using the USL, LSL and Cpk value, the result will be calculated and display the appropriate alert with red if NG for Cp, Cpk ,Pp, Ppk values. If the result is good, then green text will be displayed to Cp, Cpk, Pp, Ppk in the chart.
"ShanuSPCCpCPK_Demo" folder - This folder contains the demo program which includes the ShanuCPCPKChart user control with Random Data sample.
Note: I have used DataTable as the data input for the User Control. From the Windows Form, we need to pass the DataTable to User control to plot the Cp, Cpk, Pp and Ppk result with SPC Range Chart.
Save Chart User can save the Chart by double clicking on the chart control or by right click the chart and click Save.
Using the Code
I have used Visual Studio 2010.
1) SPC User Control Program
First, we will start with the User Control. To create a user control:
- Create a new Windows Control Library project.
- Set the Name of Project and click OK (here, my user control name is
ShanuCPCPKChart). - Add all the controls which are needed.
- In code behind, declare all the
public variables and Public method. In User control, I have added one panel and one Picture Box Control.
public DataTable dt = new DataTable();
        Font f12 = new Font("arial", 12, FontStyle.Bold, GraphicsUnit.Pixel);
        Pen B1pen = new Pen(Color.Black, 1);
        Pen B2pen = new Pen(Color.Black, 2);
        Double XDoublkeBAR = 0;
        Double RBAR = 0;
        Double XBARUCL = 0;
        Double XBARLCL = 0;
        Double RANGEUCL = 0;
        Double RANGELCL = 0;
        Double[] intMeanArrayVals;
        Double[] intRangeArrayVals;
        Double[] intSTDEVArrayVals;
        Double[] intXBARArrayVals;

        int First_chartDatarectHeight = 80;
        Font f10 = new Font("arial", 10, FontStyle.Bold, GraphicsUnit.Pixel);
        LinearGradientBrush a2 = new LinearGradientBrush(new RectangleF(0, 0, 100, 19),
        Color.DarkGreen, Color.Green, LinearGradientMode.Horizontal);
        LinearGradientBrush a3 = new LinearGradientBrush(new RectangleF(0, 0, 100, 19),
        Color.DarkRed, Color.Red, LinearGradientMode.Horizontal);
        LinearGradientBrush a1 = new LinearGradientBrush(new RectangleF(0, 0, 100, 19),
        Color.Blue, Color.DarkBlue, LinearGradientMode.Horizontal);
Once the variable is declared, I create a public function as Bindgrid. This function will be used from Windows Form to pass the DataTable. In this function, I will check for the DataTable and if the DataTable is not null, I refresh the PictureBox which will call the PictureBox paint method to Plot all new values for SPC Chart.
public void Bindgrid(DataTable dtnew)
        {
            if (dtnew != null)
            {
                dt = dtnew;
                PicBox.Refresh();
            }
        }
In PictureBox paint event, I will check for the DataTable data. Using the data, I calculate and draw the result of all Sum, Mean, Range, Cp, Cpk, Pp and Ppk to the SPC Chart. Using this information, I have created UCL and LCL by Standard formula. For details about UCL and LCL calculation, kindly check the above links. After all the values are calculated, I will draw the SPC chart in PictureBox using GDI+ and display the result to the end user.
public void PicBox_Paint(object sender, PaintEventArgs e)
{
if (dt.Rows.Count <= 0)
{
return;
}
int opacity = 68;
e.Graphics.DrawString(ChartWaterMarkText,
new Font("Arial", 72),
new SolidBrush(Color.FromArgb(opacity, Color.OrangeRed)),
80,
PicBox.Height / 2 - 15);
int NoofTrials = dt.Rows.Count;
int NoofParts = dt.Columns.Count - 1;
intMeanArrayVals = new Double[NoofParts];
intRangeArrayVals = new Double[NoofParts];
intSTDEVArrayVals = new Double[NoofParts];
intXBARArrayVals = new Double[NoofParts];
if (dt.Rows.Count <= 0)
{
return;
}
PicBox.Width = dt.Columns.Count * 50 + 40;
e.Graphics.DrawRectangle(Pens.Black, 10, 10, PicBox.Width - 20,
First_chartDatarectHeight + 78);
e.Graphics.DrawLine(B1pen, 10, 25, PicBox.Width - 10, 25);
e.Graphics.DrawLine(B1pen, 10, 45, PicBox.Width - 10, 45);
e.Graphics.DrawLine(B1pen, 10, 65, PicBox.Width - 10, 65);
e.Graphics.DrawLine(B1pen, 10, 85, PicBox.Width - 10, 85);
e.Graphics.DrawLine(B1pen, 10, 105, PicBox.Width - 10, 105);
e.Graphics.DrawLine(B1pen, 10, 125, PicBox.Width - 10, 125);
e.Graphics.DrawLine(B1pen, 10, 145, PicBox.Width - 10, 145);
e.Graphics.DrawLine(B1pen, 60, 10, 60, First_chartDatarectHeight + 87);
e.Graphics.DrawLine(B1pen, 110, 10, 110, First_chartDatarectHeight + 87);
e.Graphics.DrawString("SUM", f12, a1, 14, 10);
e.Graphics.DrawString("MEAN", f12, a1, 14, 30);
e.Graphics.DrawString("Range", f12, a1, 14, 50);
e.Graphics.DrawString("Cp", f12, a1, 14, 70);
e.Graphics.DrawString("Cpk", f12, a1, 14, 90);
e.Graphics.DrawString("Pp", f12, a1, 14, 110);
e.Graphics.DrawString("Ppk", f12, a1, 14, 130);
int xLineposition = 110;
int xStringDrawposition = 14;
Double[] locStdevarr;
for (int iCol = 1; iCol <= dt.Columns.Count - 1; iCol++)
{
Double Sumresult = 0;
Double Meanresult = 0;
Double Rangeresult = 0;
Double minRangeValue = int.MaxValue;
Double maxRangeValue = int.MinValue;
locStdevarr = new Double[NoofTrials];
for (int iRow = 0; iRow < dt.Rows.Count; iRow++)
{
Sumresult = Sumresult +
System.Convert.ToDouble(dt.Rows[iRow][iCol].ToString());
Double accountLevel = System.Convert.ToDouble(dt.Rows[iRow][iCol].ToString());
minRangeValue = Math.Min(minRangeValue, accountLevel);
maxRangeValue = Math.Max(maxRangeValue, accountLevel);
locStdevarr[iRow] = System.Convert.ToDouble(dt.Rows[iRow][iCol].ToString());
}
xLineposition = xLineposition + 50;
xStringDrawposition = xStringDrawposition + 50;
e.Graphics.DrawLine(B1pen, xLineposition, 10, xLineposition,
First_chartDatarectHeight + 87);
e.Graphics.DrawString(Math.Round(Sumresult, 3).ToString(), f10,
a2, xStringDrawposition, 12);
Meanresult = Sumresult / NoofTrials;
e.Graphics.DrawString(Math.Round(Meanresult, 3).ToString(),
f10, a2, xStringDrawposition, 30);
Rangeresult = maxRangeValue - minRangeValue;
e.Graphics.DrawString(Math.Round(Rangeresult, 3).ToString(),
f10, a2, xStringDrawposition, 50);
XDoublkeBAR = XDoublkeBAR + Meanresult;
RBAR = RBAR + Rangeresult;
intMeanArrayVals[iCol - 1] = Meanresult;
intRangeArrayVals[iCol - 1] = Rangeresult;
intSTDEVArrayVals[iCol - 1] = StandardDeviation(locStdevarr);
}
XDoublkeBAR = XDoublkeBAR / NoofParts;
RBAR = RBAR / NoofParts;
XBARUCL = XDoublkeBAR + UCLLCLTYPE("A2", RBAR, NoofTrials);
XBARLCL = XDoublkeBAR - UCLLCLTYPE("A2", RBAR, NoofTrials);
RANGEUCL = UCLLCLTYPE("D4", RBAR, NoofTrials);
RANGELCL = UCLLCLTYPE("D3", RBAR, NoofTrials);
int XCirclegDrawposition = 24;
int YCirclegDrawposition = 147;
xStringDrawposition = 14;
for (int i = 0; i < intMeanArrayVals.Length; i++)
{
Color pointColor = new Color();
pointColor = Color.YellowGreen;
XCirclegDrawposition = XCirclegDrawposition + 50;
Point p1 = new Point();
p1.X = XCirclegDrawposition;
p1.Y = YCirclegDrawposition;
if (intMeanArrayVals[i] < XBARLCL)
{
pointColor = Color.Red;
}
else if (intMeanArrayVals[i] > XBARUCL)
{
pointColor = Color.Red;
}
Pen pen = new Pen(Color.SeaGreen);
e.Graphics.DrawPie(pen, p1.X, p1.Y, 18, 18, 0, 360);
e.Graphics.FillPie(new SolidBrush(pointColor), p1.X, p1.Y, 18, 18, 10, 360);
pen = new Pen(Color.Black);
e.Graphics.DrawPie(pen, p1.X + 3, p1.Y + 4, 2, 2, 10, 360);
e.Graphics.DrawPie(pen, p1.X + 11, p1.Y + 4, 2, 2, 10, 360);
e.Graphics.DrawPie(pen, p1.X + 5, p1.Y + 12, 8, 4, 10, 180);
Double d2 = d2Return(NoofTrials);
Double USLResult = USLs - LSLs;
Double RBARS = intRangeArrayVals[i] / NoofTrials;
Double Sigma = RBARS / d2;
Double CpResult = USLResult / 6 * Sigma;
xStringDrawposition = xStringDrawposition + 50;
e.Graphics.DrawString(Math.Round(CpResult, 3).ToString(),
f10, a2, xStringDrawposition, 70);
Double CpU = USLs - intMeanArrayVals[i] / 3 * Sigma;
Double CpL = intMeanArrayVals[i] - LSLs / 3 * Sigma;
Double CpkResult = Math.Min(CpU, CpL);
if (CpkResult < CpkPpKAcceptanceValue)
{
e.Graphics.DrawString(Math.Round(CpkResult, 3).ToString(),
f10, a3, xStringDrawposition, 90);
}
else
{
e.Graphics.DrawString(Math.Round(CpkResult, 3).ToString(),
f10, a2, xStringDrawposition, 90);
}
Double PpResult = USLResult / 6 * intSTDEVArrayVals[i];
e.Graphics.DrawString(Math.Round(PpResult, 3).ToString(),
f10, a2, xStringDrawposition, 110);
Double PpU = USLs - intMeanArrayVals[i] / 3 * intSTDEVArrayVals[i];
Double PpL = intMeanArrayVals[i] - LSLs / 3 * intSTDEVArrayVals[i];
Double PpkResult = Math.Min(PpU, PpL);
if (PpkResult < CpkPpKAcceptanceValue)
{
e.Graphics.DrawString(Math.Round(PpkResult, 3).ToString(),
f10, a3, xStringDrawposition, 130);
}
else
{
e.Graphics.DrawString(Math.Round(PpkResult, 3).ToString(),
f10, a2, xStringDrawposition, 130);
}
}
picSpcChart.Width - 20, First_chartDatarectHeight);
int chartAvarageDatarectHeight = 18;
e.Graphics.DrawRectangle(Pens.Black, 10, First_chartDatarectHeight + 96,
PicBox.Width - 20, chartAvarageDatarectHeight);
e.Graphics.DrawLine(B2pen, 476, 194, 480, 176);
e.Graphics.DrawString
("MEAN CHART", f12, a1, 14, First_chartDatarectHeight + 98);
e.Graphics.DrawString
("XBarS:", f12, a1, 160, First_chartDatarectHeight + 98);
e.Graphics.DrawString(Math.Round(XDoublkeBAR, 3).ToString(),
f12, a2, 202, First_chartDatarectHeight + 98);
e.Graphics.DrawString("UCL:", f12, a1, 300, First_chartDatarectHeight + 98);
e.Graphics.DrawString(Math.Round(XBARUCL, 3).ToString(),
f12, a2, 330, First_chartDatarectHeight + 98);
e.Graphics.DrawString("LCL:", f12, a1, 400, First_chartDatarectHeight + 98);
e.Graphics.DrawString(Math.Round(XBARLCL, 3).ToString(),
f12, a2, 430, First_chartDatarectHeight + 98);
e.Graphics.DrawString("RANGE CHART", f12, a1, 490, First_chartDatarectHeight + 98);
e.Graphics.DrawString
("RBar : ", f12, a1, 600, First_chartDatarectHeight + 98);
e.Graphics.DrawString(Math.Round(RBAR, 3).ToString(), f12,
a2, 638, First_chartDatarectHeight + 98);
e.Graphics.DrawString("UCL : ", f12, a1, 700, First_chartDatarectHeight + 98);
e.Graphics.DrawString(Math.Round(RANGEUCL, 3).ToString(),
f12, a2, 734, First_chartDatarectHeight + 98);
e.Graphics.DrawString("LCL : ", f12, a1, 800, First_chartDatarectHeight + 98);
e.Graphics.DrawString(Math.Round(RANGELCL, 3).ToString(),
f12, a2, 834, First_chartDatarectHeight + 98);
e.Graphics.DrawLine(B2pen, 860, 194, 866, 176);
e.Graphics.DrawString("USL : ", f12, a1, 880, First_chartDatarectHeight + 98);
e.Graphics.DrawString(Math.Round(USLs, 3).ToString(),
f12, a2, 910, First_chartDatarectHeight + 98);
e.Graphics.DrawString("LSL : ", f12, a1, 960, First_chartDatarectHeight + 98);
e.Graphics.DrawString(Math.Round(LSLs, 3).ToString(),
f12, a2, 990, First_chartDatarectHeight + 98);
DrawLineChart(e.Graphics, intMeanArrayVals, XBARUCL, XBARLCL,
PicBox.Width - 70, 154, 60, 170, "MEAN", XDoublkeBAR);
DrawLineChart(e.Graphics, intRangeArrayVals, RANGEUCL,
RANGELCL, PicBox.Width - 70, 154, 60, 340, "RANGE", RBAR);
}
2) Demo Program
Now we create a Windows application and add and test our "ShanuCPCPKChart" User Control.
- Create a new Windows project.
- Open your form and then from Toolbox > right click > choose items > browse select your user control DLL and add.
- Drag the User Control to your Windows Form.
- Call the "
Bindgrid" method of user control and pass the Datatable to Usercontrol and check the result.
Global Variable Declaration
#region Local Vairables
        DataTable dt = new DataTable();
        private static readonly Random random = new Random();
        Double gridMinvalue = 1.2;
        Double gridMaxvalue = 2.4;
        int totalColumntoDisplay = 20;
        Double USLs = 2.27;
        Double LSLs = 1.26;
        Double CpkPpkAcceptanceValue = 1.33;
        #endregion
Form Load Event
In form load event, I call the loadGridColumn() method. In this function, I add the columns for the datatable. I have used 20 columns which will be used to add 20 sample data with 5 trials.
public void loadGridColums()
{
dt.Columns.Add("No");
for (int jval = 1; jval <= totalColumntoDisplay; jval++)
{
dt.Columns.Add(jval.ToString());
}
}
Next in form load event, I call the loadgrid() method. In this method, I generate sample random numbers for 20 columns to plot our chart.
public void loadgrid()
        {
            dt.Clear();
            dt.Rows.Clear();
            for (int i = 1; i <= 5; i++)
            {
               DataRow row = dt.NewRow();
                row["NO"] = i.ToString();
                for (int jval = 1; jval <= totalColumntoDisplay; jval++)
                {
                    row[jval.ToString()] = RandomNumberBetween(gridMinvalue, gridMaxvalue);
                }

                dt.Rows.Add(row);
            }
            dataGridView1.AutoResizeColumns();
            dataGridView1.DataSource = dt;
            dataGridView1.AutoResizeColumns();
        }
Next in form load, I have passed the USL, LSL, Cpk Value and Datatable to “shanuCPCPKChart” User control to generate XBAR and Range Chart with Cp, Cpk, Pp and Ppk result.
private void Form1_Load(object sender, EventArgs e)
        {
            loadGridColums();
            loadgrid();
            USLs = Convert.ToDouble(txtusl.Text);
            LSLs = Convert.ToDouble(txtLSL.Text);
            CpkPpkAcceptanceValue = Convert.ToDouble(txtData.Text);
            shanuCPCPKChart.USL = USLs;
            shanuCPCPKChart.LSL = LSLs;
            shanuCPCPKChart.CpkPpKAcceptanceValue = CpkPpkAcceptanceValue;
            shanuCPCPKChart.Bindgrid(dt);
        }
To display the real time data chart result, here I have used the timer and can bind the data using random data and pass all the result to the user control to refresh and display the result.
private void timer1_Tick(object sender, EventArgs e)
        {
            loadgrid();
            USLs = Convert.ToDouble(txtusl.Text);
            LSLs = Convert.ToDouble(txtLSL.Text);
            CpkPpkAcceptanceValue = Convert.ToDouble(txtData.Text);
            shanuCPCPKChart.USL = USLs;
            shanuCPCPKChart.LSL = LSLs;
            shanuCPCPKChart.CpkPpKAcceptanceValue = CpkPpkAcceptanceValue;
            shanuCPCPKChart.Bindgrid(dt);
        }
Points of Interest
I will be happy to say that this will be the first SPC Cp, Cpk, Pp and Ppk Chart control which is available for free with the source code. If you like these controls, kindly do vote for the article.
History
- 2nd July, 2015: Initial version


 General
  News
News  Suggestion
  Question
  Bug
Bug  Answer
  Joke
Joke  Praise
  Rant
Rant  Admin
Admin 


