Introduction
Chart and graph are common in almost all business applications. In Web Form, we can use Microsoft’s chart tool to implement various charts which are pretty simple and nice in look but in MVC, how we will implement chart? Probably there are many approaches like you may use JavaScript based chart which deals with JSON data and there are ‘n’ number of JavaScript frameworks which serves charts and graphs. But in this example, we will use Microsoft’s in built chart which is defined within “System.Web.Helpers” namespace. So, let’s create one MVC application and add the below view into it. The view is very simple to understand. It contains just three image element. The Url.Action() is pointing to three different actions which are defined within current controller.
@{
    Layout = null;
}
<!DOCTYPE html>
<html>
<head>
    <meta name="viewport" content="width=device-width" />
    <title>Index</title>
</head>
<body>
    <div>
        <table>
            <tr>
                <td>
                    <img src="@Url.Action("CreateBar")" alt="Bar Chart using MVC" />
                </td>
                <td>
                    <img src="@Url.Action("CreatePie")" alt="Pie Chart using MVC" />
                </td>
            </tr>
            <tr>
                <td colspan="2">
                    <img src="@Url.Action("CreateLine")" alt="Line Chart using MVC" />
                </td>
            </tr>
        </table>


    </div>
</body>
</html>
Now, we have to define the controller and actions to implement chart. Have a look at the below code:
using System;
using System.Collections.Generic;
using System.Configuration;
using System.Linq;
using System.Web;
using System.Web.Mvc;
using System.Web.Routing;
using System.Web.SessionState;
using System.Web.Helpers;
namespace Authentication.Controllers
{
public class HomeController : Controller
{
public ActionResult CreateBar()
{
var chart = new Chart(width:300,height:200)
.AddSeries( chartType: "bar",
xValue: new[] { "10 ", "50", "30 ", "70" },
yValues: new[] { "50", "70", "90", "110" })
.GetBytes("png");
return File(chart, "image/bytes");
}
public ActionResult CreatePie()
{
var chart = new Chart(width: 300, height: 200)
.AddSeries(chartType: "pie",
xValue: new[] { "10 ", "50", "30 ", "70" },
yValues: new[] { "50", "70", "90", "110" })
.GetBytes("png");
return File(chart, "image/bytes");
}
public ActionResult CreateLine()
{
var chart = new Chart(width: 600, height: 200)
.AddSeries(chartType: "line",
xValue: new[] { "10 ", "50", "30 ", "70" },
yValues: new[] { "50", "70", "90", "110" })
.GetBytes("png");
return File(chart, "image/bytes");
}
public ActionResult Index()
{
return View("Index");
}
}
}
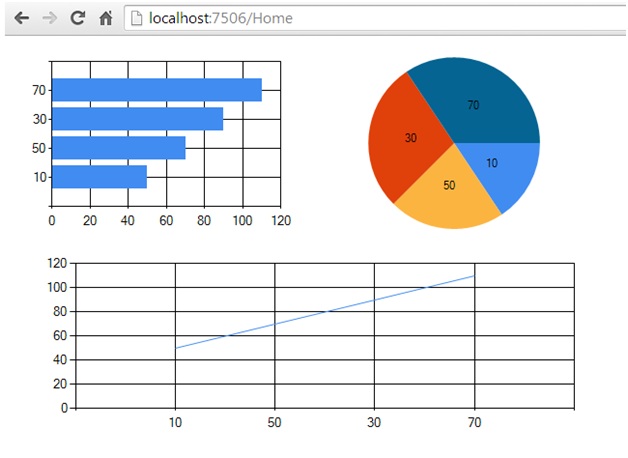
The code is very clear and self explanatory. We have set various parameters of Chart class and calling the AddSeries() method to set value in X and Y axis, then we are setting value “png” as argument of GetBytes() function, so it will return “png” image as chart. At last, we are returning File as return data of action and in output, we will see that three different charts will get created as below:
Border Line
The chart has generated with default setting, in need we can implement our custom look and feel. The chart is very simple and easy to implement compared to various JavaScript based charts and even we can render this chart asynchronously so that it will reduce render time.
I am software developer from INDIA. Beside my day to day development work, i like to learn new technologies to update myself. I am passionate blogger and author in various technical community including dotnetfunda.com , c-sharpcorner.com and codeproject. My area of interest is modern web technology in Microsoft stack. Visit to my personal blog here.
http://ctrlcvprogrammer.blogspot.in/


 General
  News
News  Suggestion
  Question
  Bug
Bug  Answer
  Joke
Joke  Praise
  Rant
Rant  Admin
Admin 


