
How to use OLAP cubes for reporting, and get your business users the data they need today.
4.00/5 (1 vote)
Jan 7, 2007
5 min read
41258
Creating reports today has become a nightmare for a lot of developers. I can contest to the late nights and many lines of code in order to build custom reports, then have a user never use a report because it was slow or did not contain the data they wanted to see.
This is a showcase review for our sponsors at CodeProject. These reviews are intended to provide you with information on products and services that we consider useful and of value to developers.
Introduction
Creating reports today has become a nightmare for a lot of developers. I can contest to the late nights and many lines of code in order to build custom reports, then have a user never use a report because it was slow or did not contain the data they wanted to see.
In today's environment there are a lot of options available for reporting. You can use reporting packages like Crystal Reports, Reporting Services or build custom reports using chart and grid components. I want to take a minute and go over good reporting architecture. If you are developing reporting systems for large databases or applications that have a lot of users, you should be concerned with building reports off your transaction tables. Here are the main reasons to stay away from this design:
-
It negatively impacts application performance when people run reports.
-
As data in the tables get bigger, the reports slow down.
-
It can be very difficult to manage and might require "summary" tables in your OLTP (Online Transaction Processing Database) – This can be difficult to manage, and new developers may have a hard time understanding the tables
-
There is already a solution available for putting together a summary and rollup of data, and it is called OLAP (Online Analytical Processing). You can use OLAP out of the box with SQL 2000 and SQL 2005 (SQL 2005 is a complete rewrite and offers a wealth of new features and better performance though).
What is OLAP?
OLAP is an acronym for On Line Analytical Processing. It is an approach to quickly provide the answer to analytical queries that are dimensional in nature. It is part of the broader category business intelligence, which also includes Extract transform load (ETL), relational reporting and data mining. The typical applications of OLAP are in business reporting for sales, marketing, management reporting, business process management (BPM), budgeting and forecasting, financial reporting and similar areas. The term OLAP was created as a slight modification of the traditional database term OLTP (On Line Transaction Processing). More on Wikipedia
Now that we have covered the reasons to not build reports on top of your OLTP database, I want to point you to a simple 10 minute lesson on creating an OLAP database. Watch the video
We have the perfect developer tool for viewing this OLAP database. It is called BIViewer. Here are the simple steps to adding BIViewer to your project:
- Download the demo version from our site: Click here to download
- Create or install a simple OLAP Cube.
- Add a reference to the control in your toolbox or use the sample project included in the demo.
- Set the connection string to the OLAP server and database you are using. Some important notes on security.
- Microsoft OLAP uses Windows Authentication ONLY!
- You have to setup security in one of the following ways
- Your users can login to IIS using Windows Authentication
You will need to add all the users to the Roles in the cube with the correct access rights, or you can use their AD group - You can map your IIS account to a domain account
You will need to add all the users to the Roles in the cube with the correct access rights, or you can use their AD group - You can impersonate your application to use a domain account
You will need to add all the users to the Roles in the cube with the correct access rights, or you can use their AD group
- Your users can login to IIS using Windows Authentication
Once you get through the steps above, you will have a very robust and advanced reporting system for your application. Let's go over some of the features of BIViewer and how you can use them.
The interface is designed to be very user friendly. Here is the basic layout:

Some important definitions / terms:
- Cube: This is an OLAP database that you have developed in Analysis Services.
- Drill-Down: This is used to drill into a hierarchical set of data. For example: Product Categories contain a group of Products.
- Measures: These are the metrics you are interested in reporting on.
- Dimensions: These are the items or elements you want to include in your report. Examples: product category, color, or size.
- Drill-Though: This context menu item enables you to see the underlining OLAP data rows that make up the summary data you see in a cell of the report.
One of the hardest parts for users of reporting packages is the ability to understand the data they are looking at. We have tried to help users to understand report data by providing special 3D charting options. Here is a view of the data (we used excel export to get it):
|
Product Categories |
No Discount |
Reseller |
|
Internet Sales Amount |
Internet Sales Amount |
|
|
Accessories |
$698,829.49 |
$1,930.47 |
|
Bikes |
$26,275,339.85 |
$2,042,804.80 |
|
Clothing |
$333,437.74 |
$6,334.87 |
|
Execution Time: 0 min, 0 sec, 31 ms / Render Time: 0 min, 0 sec, 296 ms |
||
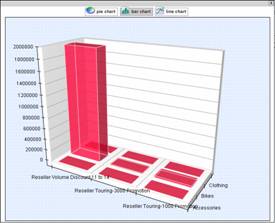
Most business users have a hard time looking at tables of numbers. For that reason, we have added some 3D reporting options. My favorite option is the 3D bar charts.
|
|
This format makes it easy for users to see the difference in the numbers between 3 different axes of data. Where the grid layout did not do as good of a job. |
Some other features worth mentioning in BIViewer:
|
Ability to save reports as xml and load them again later |
|
|
You can set filters on reports and (optionally) prompt a user to populate filters when they run the report. |
|
|
We use breadcrumb navigation when drilling into data instead of a hard to read header table. This makes it easy to understand where you are in the data. |
|
|
Export to PDF and Excel |
|
|
Ability to drill-down into data |
|
|
Ability to drill-through data (Be able to see the data under the query) |
|
|
Ability to compare multiple measures next to each other |
|
|
The control is licensed to be very affordable for all developers and projects |
$399.00 per domain name / company |


