Azure Website 101: KUDU the secret door !
5.00/5 (1 vote)
Since Azure Website are PaaS that means you don't have the headache to upgrade and maintain the machine where you site is running but one caveat that it has that it not let you RDP even though you are running your site in STANDARD mode. This article tell you about KUDU which is the secret door of AZ
A good number of people prefer IaaS (Infrastructure as a Service) solution over PaaS (Platform as a Service) and the reason they like to tell us is that they can RDP on the server to make any changes to their website. But the contrary as you might get choosing IaaS solution means some extra work like updating the OS and its patches, maintaining the network infrastructure as so on comes on the developers end. To me these are just overkill of your time. I like PaaS solution (Microsoft Azure Website (MAWS) is a PaaS) because that let me focus on my project rather then the infrastructure where my solution will actually run. But what If I still would like to have a little more control over my Websites once I deployed in MAWS?
The solution is to use the secret door of Azure Websites : the KUDU debug console!
Tell me more about that secret door (KUDU) :
The KUDU Console is a tool that gives you both command line and file browser access to your site from where you can get server information thats running your MAWS. Additionally, if you want you can also execute powershell scripts to do variety of work from creating a brand new website to run a scheduler/webjobs, everything!
Did You Know?
Previously KUDU was only used for local git deployment.
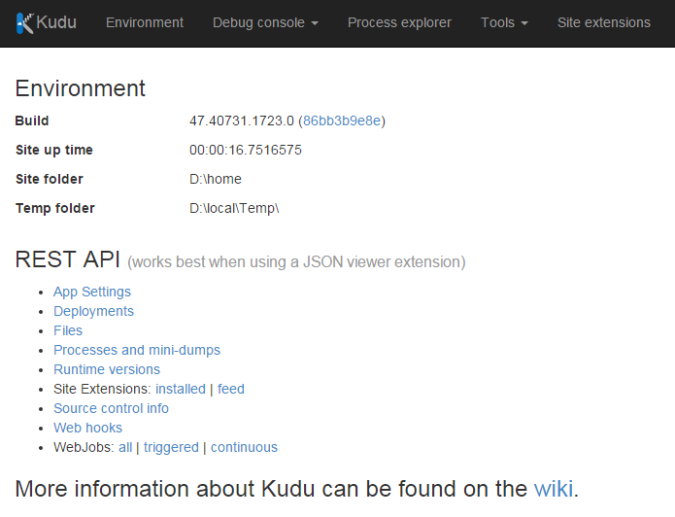
The image below shows the KUDU dashboard. It contains several tools (Debug Console, Diagnostics Dump, Log Stream etc) that you can use to manage, monitor and debug your site.
Where is the secret door?
As the title says its a secret door, so obviously you won't see the door unless you type the magic word in URL of your browser. Simply insert SCM in the URL of your Website between your website name and the azurewebsites.net domain like this:{yoursite}.scm.azurewebsites.net. For example if your site name is testsite.azurewebsites.net then to navigate to the secret world you have to hit testsite.scm.azurewebsites.net
As soon you want to pass the secret door the door keeper will ask for credential. This console runs under HTTPS and is protected by your deployment credentials. Once you enter your Microsoft account credentials (unless already signed-in), you reach the Kudu dashboard of your site.
Now that we have got the access on KUDU dashboard (the secret door to azure website) the next thing that we would like to do is to figure how much power and control we got over our azure website by accessing the KUDU dashboard.
As you can see the dashboard Tab like Environment, Debug console, Process Explorer titles are pretty much self explanatory. Lets discuss one by one.
Environment
The environment page can help you see what your website “sees” in terms of the current environment it’s running on. While the "System Info" section can can help you to find out the the details of the server, other sections like AppSettings, Environment variable can tell about their respective information.
NOTE:
While there is a Connections strings section, it may not be exactly what your site sees as connection strings.
Debug Console
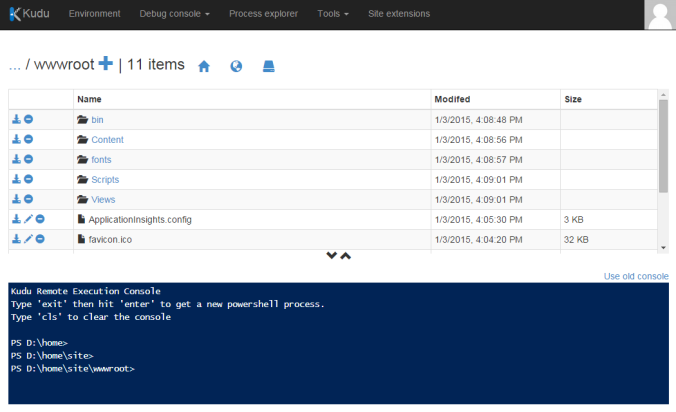
KUDU console offers you to enjoy the best of both world. Based on your expertise can use both CMD or the Powershell terminal to run arbitrary external commands/scripts. The thing that I like most of this page is that the console window and UI portion (Tree view of folder structure) works simultaneously. In other words, “current directory” is synced between the file explorer and the terminal for ease of use.
In fact you can use this as the replacement of FTP client ! Both the UI and the terminal lets you to check file hierarchy. From there you can download, edit or delete particular file (or full folders). Not only this but this also gives you the flexibility to use the drag & drop feature to upload your desired file in the appropriate location. You can check this for a good reference.
A good example of a scenario where this feature might come in handy could be like this- imagine you were in the middle of journey and your client called you on your phone and asked you to do a hot fix by changing some minor change on the production site. Remember you don’t have your development laptop with you but you have access to a browser! Well, if this is the case then you can do some basic minor fixes and changes right away from the secret door that I introduced you here (i.e. Kudu Debug Console).
Heads UP:
Keep in mind that you are editing the live site here so be CAREFUL and don’t forget to change the source in the repository later. Also note that If you are making changes on the Web.Config file then your site will restart which means all the users session (who are currently connected with your site) will get dump with the restart !
Some of you might planning to tell me what are the good practices we should follow. Yes, I know, best practices say “don’t do this!” but don't you think at the middle of your journey when you don't have access to your development machine with a site down this is just amazing to have some direct access to your site just by using a browser?
Process Explorer
Process Explorer shows the processes that are currently running, Clicking the properties button will show the details of that particular w3wp instance.
Figure : Kudu Process Explorer
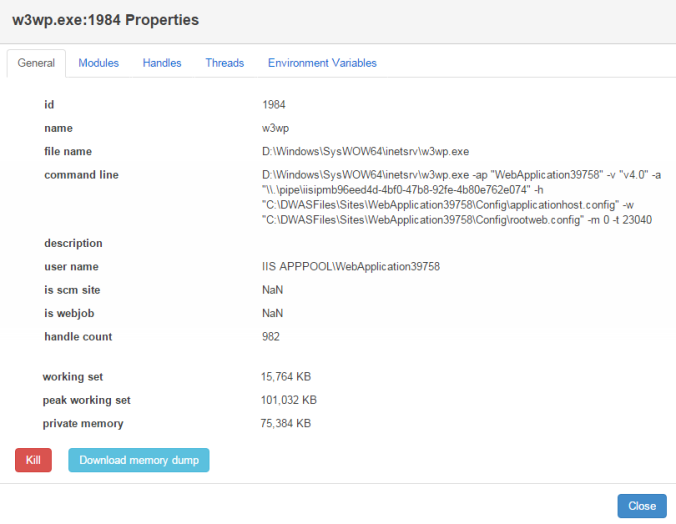
This will pop up a new window from where you can find out the running threads, attached handlers and environment variable. In its addition, if you want you can also download "memory dumps" for further analysis.
 Figure : Inside w3wp.exe process
Tools
Other tools that ships with KUDU dashboard are diagnostic dumps, log steam and web hooks. Log steam is pretty much helpful in case you want to check live log messages (which you sent through System.Diagnostics.Trace.WriteLine) popping up on your kudu dashboard.
Good Read:
- http://blog.davidebbo.com/2012/06/developing-kudu-locally-and-on-azure.html
- http://www.devtrends.co.uk/blog/azure-web-sites-git-deploy-for-multiple-project-solutions
- http://www.hanselman.com/blog/StreamingDiagnosticsTraceLoggingFromTheAzureCommandLinePlusGlimpse.aspx
- http://blogs.msdn.com/b/asiatech/archive/2013/07/18/using-kudu-to-capture-hang-dumps-for-windows-azure-web-sites.aspx
- http://blogs.msdn.com/b/asiatech/archive/2013/07/18/using-kudu-to-capture-hang-dumps-for-windows-azure-web-sites.aspx


