
Running the Relay: A Case Study Using the Intel® Galileo Board
0/5 (0 vote)
This article presents a case study in which the Penang Assembly and Test Operation (PGAT) unit for Intel greatly improved overall production testing performance and facilitated test unit repair by using the Galileo board and associated integrated development environment.
Introduction
A significant challenge for the emerging Internet of Things (IoT), where everyday devices communicate with one another over the Internet, is the translation of electronic sensor output, such as a temperature change on a refrigerator suggesting a possible or likely failure, into computer-friendly messages. The Intel® Galileo board was created to serve just this purpose. A Linux*-based programmable platform (i.e., C/C++), the Galileo board contains built-in capabilities such as multiple communication ports, power regulation, on-board and expandable memory, and direct support for Arduino software development programs using the board’s firmware Arduino I/O adapter. This allows the use of directly pluggable "shields" that can provide a variety of input signals to the Galileo board. These inputs can be converted into any form of computer-readable messages that are then transmitted off the board using one of several available communication ports, such as USB, Wi‑Fi*, Bluetooth*, and RS‑232 (see Figure 1).

This article presents a case study in which the Penang Assembly and Test Operation (PGAT) unit for Intel greatly improved overall production testing performance and facilitated test unit repair by using the Galileo board and associated integrated development environment.
Detection of Relay Operation
The PGAT group is responsible for ensuring the correctness of chip manufacturing for Intel. As part of the testing process, a test interface unit (TIU) evaluates proper chip behavior, but one of the key components of the TIU, a mechanical relay switch, can wear out and fail without warning. When these relay switches fail, significant time (1–3 days of expert troubleshooting) is required to identify and replace the failed component, which has a dramatic and undesirable effect on the availability of the TIU and reduces the overall efficiency of the testing process.
To address this issue, the PGAT team devised a mechanism to detect, track, and identify relay switches reaching their end of life (EOL). The basic technique is illustrated in Figure 2. In this diagram, the TIU is shown schematically as a series of relays, one of which is reaching EOL and another of which has failed completely.

The relay detection board taps into the TIU using a series of probes across the relay hardware connections without affecting the existing system design (e.g., plug-and-play approach). Voltage applied across the relay coil signifies a single relay toggle event. The toggle count for the specific relay is then incremented by one. In addition, the TIU itself powers the daughter board directly, removing the need for a separate power supply. This solution is therefore portable to any testing device that requires monitoring without consideration for the dangers inherent in separate battery power (i.e., battery power depletion interrupting monitoring or overheating and possible explosion).
Using this measurement methodology, the PGAT group has determined through experimentation that the system is capable of measuring relay toggles from multiple relays in parallel (up to 48 concurrent measurements per detection card) and on a time frame of milliseconds for the actual event. The only real limitation on the measurement speed is the need to process the probe data for proper storage and analysis. In actual production usage, the typical relay switching speed is well within the capability of the measurement technique, validating the efficacy of the approach.
The determination of a relay that is reaching EOL is based on the measured count of relay toggles compared with the manufacturer mean time between failure certification for the component. In the case of a standard mechanical relay, the typical maximum switching count is 10 million coil energization events. This is the baseline value that PGAT used when identifying a relay that is to be replaced. In the case of a failed relay, the measurement device detects zero relay toggle events, even though the testing protocol expected one or more events on that particular relay. Because of the continuous monitoring and real-time reporting of this approach, these failing (or failed) components can be readily detected, identified, and replaced before a significant loss of productivity occurs.
In the current configuration, the monitoring hardware of the daughter board is specifically designed to measure the energizing of a relay coil. However, this design is the basis of monitoring and replacing virtually any electronic component subject to wear and tear. For example, consider a failed integrated chip, where the detection event would directly show which chip failed and at what position on the production floor.
Acquisition of Relay Performance Data
The Galileo board is a remarkable tool. It provides several important features that help make the IoT a reality. The first is the built-in capability to acquire electronic signal data from virtually any common source, be it a physical connection like USB, RS‑232 serial, Ethernet, or Arduino I/O adapters or wirelessly via Wi‑Fi or Bluetooth signals. Second, the Galileo board can translate the electronic signals into standard computer-readable messages, such as User Datagram Protocol (UDP), binary, or XML, in real time with minimal processing overhead. Finally, the built-in operating system and expandable memory allow for temporary on-board storage and preprocessing of analytical data before the messages are forwarded to a target server for additional operations or actions.
For the relay counter, when the relay toggle event is detected, the information on that event is transferred from the detection board to the Galileo board for further manipulation. As noted earlier, the Galileo board allows a variety of data-transfer mechanisms, including a standard RS‑232 serial connection port. Using this port, the relay detection board transmits the various toggle events that are captured on the Galileo board; converted into an encrypted, secure data message; and transmitted to the analysis server. Although not currently programmed to do so for the relay counter, preliminary data analysis can be performed right on the Galileo board prior to transmission.
To make the hardware processing simple and efficient, the PGAT group decided to use UDP datagrams as the standard messaging protocol, chosen over other possible solutions such as file transfer via TCP/IP. UDP datagrams are a common data format, well suited to the current diagnostic purpose. The encrypted UDP message is kept deliberately small to avoid the problem of dropped data packets. In addition, data corruption is kept to a minimum through the introduction of special algorithms on the Galileo board that ensure accuracy between the transmission and reception of the data messages.
Transport and Storage of Measurement Information
As noted in the previous section, when the Galileo board has received the relay device detection signal, it is immediately processed into a UDP-encrypted datagram. This message is then sent to a dedicated processing server using the Ethernet connection on the board. When the packet arrives at the processing server, it is captured by a dedicated Perl script that then translates the UDP message and stores the data in a persistent data store. Perl was chosen for several reasons: first, it is a commonly known language that works well with flow-through messaging; second, it is easy to code for prototype development; and third, it provides most of the necessary data-handling utilities as part of the base installation. Other languages, and in particular compiled languages such as C, Java*, or C++, can certainly be used for data handling and storage in a more robust, production-quality implementation.
Although the storage mechanism in this case study was not disclosed, it should be clear that any type of data persistence would work well with this solution. For example, instead of using a standard relational database, the messages could be stored in a distributed data processing store using Apache Hadoop* if large quantities of data were collected for further analysis, such as trending or predictive analytics. Alternatively, a simple in-memory database (backed by a file system in the event of power loss) may be sufficient to keep a detailed record of each monitored component.
Data Presentation and Predictive Analytics
When the relay toggle counts have been captured and stored, the next step is to create an application to display the data. In this case, a specialized web application was created (using standard Microsoft .NET programming tools). In Figure 3, this user interface allows direction identification and localization of relay switches that are nearing EOL and others that may have already failed.
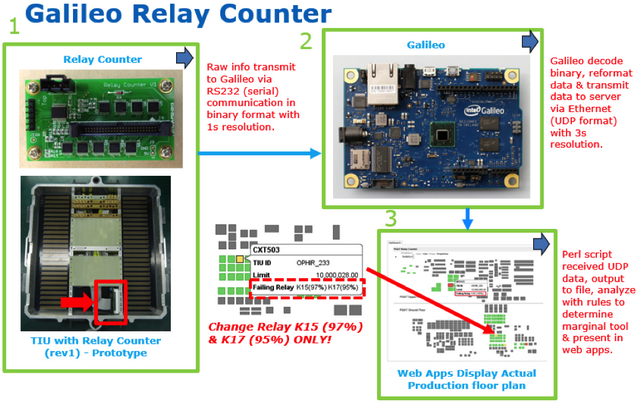
In this way, the primary function of the overall solution—the early detection and replacement of failing relay switches prior to a loss of utility—is facilitated in real time. The full production floor can be visualized, and a simple mouse-over event on a suspect relay will detail the exact location and current relay life expectancy.
The solution as presented places a warning indicator (shown as a yellow box rather than the green one in Figure 3) when the component has reached 95 percent of the expected usable lifetime. This translates to 9.5 million relay toggle events for a standard relay switch. This value can be applied in aggregate across the entire TIU as an indicator of "U‑Loss," where the percentage of actual testing time is reduced because of failure of a TIU. By analyzing the relay count data against the actual failure rates, a questionable TIU (that may have abnormal relay failure resulting from temperature variation; voltage fluctuation; or another, non-relay-related issue) can be detected and removed from service before it can affect the overall U‑Loss value.
As a direct enhancement to this approach, the processing system can employ straightforward predictive analytics and probability analysis to determine test units that are experiencing an abnormal amount of relay replacements, potentially indicating a bad batch of relay switches. The data can then be shared with the manufacturer to resolve production quality issues and ensure that the test team is receiving the expected lifetimes for the delivered components. Alternatively, the relay count data can be used in a trending analysis to see how performance of relays varies from tested product to product.
Finally, it is possible not only to detect the relay toggle event but to measure the actual time the component takes to go from a nonenergized to a fully energized state (represented by the anticipated relay switching time). This information can be cross-compared with the overall count data not only to identify the likelihood of component failure (caused by fatigue of the element) but also to visualize the degradation of capability as a function of usage.
Conclusion
The current case study detailed the creation of a monitoring and reporting tool directed toward improving the Intel product testing team’s ability to deliver value to the manufacturing team. By directly detecting, measuring, and visualizing TIU relay performance, valuable testing time is saved and outages avoided. As this article showed, this approach can be generalized to a variety of sensors and detectors, which can then provide direct information on the behavior of the mechanical or electronic device. And with a true plug-and-play approach, where the underlying component is unaffected by the presence of the detection device, the Galileo IoT approach can be applied to virtually any powered device.
The ability to perform sensor trend analysis in real time using the IoT approach that the Galileo board facilitates allows for a flexible, dependable, and extensible mechanism whereby devices can monitor themselves and each other without human intervention, independently scheduling necessary maintenance and facilitating trouble detection and resolution. Moreover, using predictive analytics and trending studies, patterns of use can be highlighted, leading to better preventative care and increased customer satisfaction.
The PGAT group is actively working on this and other interesting IoT solutions using the Galileo board. Stay tuned.
References
- Intel Internet-of-Things (IoT): https://software.intel.com/en-us/internet-of-things
- Intel Galileo Board Getting Started Guide: https://communities.intel.com/docs/DOC-22204
- Galileo schematic: https://communities.intel.com/docs/DOC-21822
- Galileo reference design: https://communities.intel.com/docs/DOC-21824