
LibreGrid: Drop Into Your App, In 5 Minutes CRUD Your Custom JSON Data
Drop in this React component and in 5 minutes, you can have it CRUDing your custom data.
Get all source code at my GitHub repo: GitHub - raddevus/LibreGrid: React-based component & example code which allows user to tie any JSON data set & edit data in grid.[^].
Try It Out
Try the Live Version shown in this article at my web site: https://newlibre.com/LibreGrid/[^].
YouTube Video : Loading Data From SWAPI
Later in the article I show you how to load data from the Star Wars API, but you can watch the video right now to see the LibreGrid in action.
Introduction
When I set out to build this component months ago, I didn't know it would take so long, so I hope you find it as interesting and helpful as I have.
The LibreGrid component, which I've built on top of React allows you to View, Sort, Search, Edit and generate JSON from your custom Domain Object(s).
One Requirement For Use
You must have a collection of your Domain Objects: Your domain objects must be contained in an array. This is a very common format that is used by 99% of WebAPIs anyways, so this shouldn't cause you any problem. This just means that your JSON will be in the format of:
// [ ] represents outer array
// each { } represents each domain object
[
  {
    "fake-prop": "fake-value 1"
  },
  {
    "fake-prop": "fake-value 2"
  }
]
Believe it or not, using just that simple data, I can show you how easy it is to load the LibreGrid with your custom data. It may not seem amazing yet, but when we load the results from a custom WebAPI, I believe you'll be amazed. I hope so.
Let Me Show You How Easy It Is To Use LibreGrid
Now, for the fast crowd, let me show you how easily you can use my LibreGrid component.
Then, after I show it to you in action, we'll come back here and learn a bit more about how it works.
Ugly User Interface
I actually made the UI quite ugly for now for two reasons:
- I don't want the reader to focus on what it all looks like right now.
- It's extremely easy to add a layer of CSS which will make your implementation of the LibreGrid component beautiful.
Parent & Child React Component
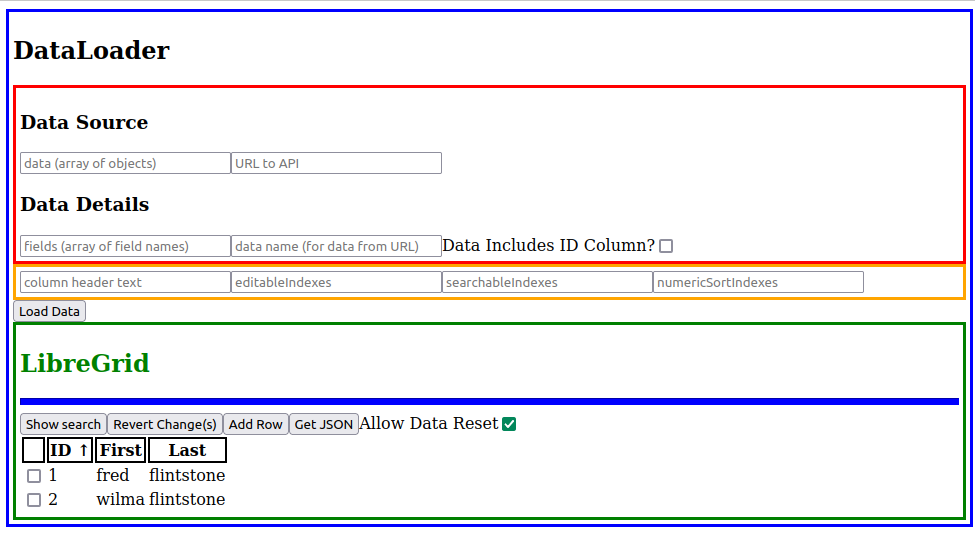
The image that follows shows the UI with two main headers (one black one & one green one). Those headers each define the area of a separate React component
DataLoader- The parent React component which I built for this article so you can see the LibreGrid in action. TheDataLoader's content ends with the [Load Data] button.DataLoaderis made up of a number of HTML Input controls (all text boxes except the one checkbox and the one [Load Data] button).
LibreGrid- Everything within the Green border is theLibreGrid(the target component we are discussing).- I've added the
LibreGridas a child component to the example so we can pass in data from the parent (DataLoader).
This is where your Domain Model data will be displayed for sorting, searching, editing & generating altered JSON.
- I've added the
DataLoader - Component Which Uses LibreGrid
Again, I've created the DataLoader entirely so I can show you how easy it is to load data into the LibreGrid and use it in your own projects and your own domain objects.
First, of all, you can see that when the app runs, it initially loads some sample data (based on Flintstones cartoon characters[^]). We can just ignore that for now.
Follow Along With Running the Code At My Web Site
Try the Live Version shown in this article at my web site: https://newlibre.com/LibreGrid/[^]
Focus on Three HTML Text Input Boxes
To begin, we will just use three of the HTML text input fields to load our data.
- Data - text input where we'll paste our JSON which represents our array of domain objects
- Fields - text input where we'll type an array of
strings which represent the field names which are found in the domain objects - Column Headers - text input where we'll type an array of
strings which will represent the header text which will appear above each column in our LibreGrid.

What's the Big Deal?
At first, when you see this, you may think it's no big deal. I understand. At first, it doesn't look like much, but you get a lot of features and I'll show you those features in just a moment. First, just allow me to point out a few things you may find odd.
A Few Important Things to Notice
- ID Column - If the data doesn't have an ID column (just an integer column which is auto-incremented), then I add one. If the data does have the value, we can handle that too.
- Sort - The data is initially sorted on the ID column in ascending fashion. However, all you have to do to sort the data is click on the column header.
- Allow Data Reset -- You'll see more about this in a moment, but it is just a way to allow the child LibreGrid component to only reload data if the user wants it to so we don't wipe out changes they've made to the data.
- Headers - Headers are just an array of strings. If you add no headers, you won't get any text over the columns and you won't have a way to click to sort the data. You can also use the exact same array of
strings you used for the Field Names but you don't have to. Fields have to match the domain object's property names, but headers are just text which is displayed.
Way More Functionality for Free
But the real power of the LibreGrid (the main component that we're actually discussing in this article) shows up when we try some of its functionality.
List of All Functionality (see associated snapshots)
- Sort the data - click either of the headers and the data is sorted
- Edit the data - You can edit any of the data except the
IDfield. To edit, double-click on any cell and it will turn into an HTML text input box allowing you to type a new value. - Revert changes - Select checkbox next to the row you want to change back and click the [Revert Changes] button.
- Add new row(s) - Click the add new row button and edit the data in each column.
- Search / Filter the Data - Click [Show Search] button and type in the search field, only matching data is displayed in grid.
- Generate JSON (includes changes you made) - Click the [Get JSON] button.
1. Sort the data - (Clicked on header twice, sorted descending)

2. Edit the data - If you click on a column that hasn't had its EditableIndex set, then you will not be able to edit the data in that column. This makes the LibreGrid ultimately custom. In order to edit the data, you have to first add its index value to the HTML Text input (shown in the image). In our case, we set it to 1. The ID columns are never editable because that doesn't really make sense (but you can change that in the source code of the LibreGrid if you like).

Once the user hits the <ENTER> button (when she is done editing the value), then the data will show that it has been changed.

3. Revert Changes - Select the checkbox next to the row you want to change and click the [Revert Changes] button.
Not much to see here, the data is back to the original values.

4. Add New Rows of data -- Click the button, the new rows are added (with new unique ID values). The data is editable (as long as you add the editableIndexes).

5. Search / Filter the Data - This is super helpful if you have a lot of data (we'll see a lot of data soon). Click the [Show Search] button and the text input field(s) will appear above each column. Type in the value you want to search for (filter data down to).
I added some data, so the example will be a bit more clear.

Type an id value in the input box... (in our example, I type a 5).

Search On Other Columns
Notice that you can only search on the ID column. We can change that in the DataLoader so that the [fake] column can also be searched on. We just need to change the searchableIndexes value. This is yet another customization on our LibreGrid.

Displaying all data in the column which has the letter 'o'.

6. Generate JSON for Your Altered Data
If you were to leave the filter on (filtered for letter 'o') and you clicked the [Get JSON] button right now, you would see the following (a popup window which displays the JSON for the displayed collection of domain objects as JSON):

If you right-click to close the window and then click the [Hide Search] button, the original collection of (unfiltered) objects will appear.

Now, if you simply click the [Get JSON] button again, you'll see the JSON that includes all your domain objects (unfiltered).

It's Kind of a Big Deal Tool
Of course, if you simply load a collection of domain objects and edit a column, then that data is reflected in the generated JSON which means that with this Open Source tool that I've created, you have a way to load, edit and generate JSON.
With all of that in mind, let's go one step further now and load data from a WebAPI to prove this thing can work with any array of data objects. We will also prove that it is possible to fetch()[^] data from a 3rd Party WebAPI.
Let's Load Some Data From a WebAPI -- Star Wars API
To prove that this works with basically any array of domain objects. I'm now going to show you how to load data from a 3rd Party WebAPI called the SWAPI (Star Wars API).
Take a Look At SWAPI For Star Wars People
First, take a look at what data is returned from the SWAPI for the list of Star Wars People (characters).
Click the following link to see the data: https://swapi.dev/api/people[^]
You will see a page that looks like this (my markup explains the details):
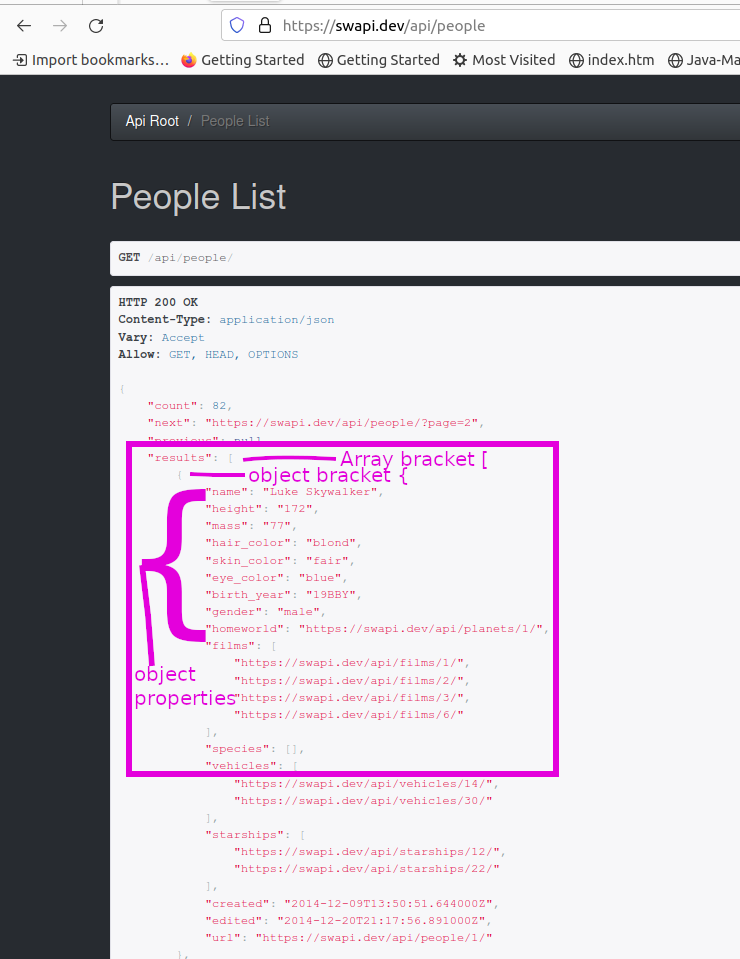
You can see that there is an Array of Domain Objects* which contain properties. This is perfect for our purposes with the LibreGrid.
*This domain contains some objects that the SWAPI devs have named People.
Loading SWAPI Data In LibreGrid
To load this data in the LibreGrid, we need the following:
- URL to WebAPI (https://swapi.dev/api/people)
- Name of the data set that is returned (the array of objects) In this case, it is named
results. This is very important because we have to tell theDataLoaderwhere the target array of objects is in the data we are retrieving. Sometimes, thewebapidirectly returns an array of objects but not always. In the case of SWAPI, there is a bunch of other data returned also -- which is like meta-data (data describing the data). - List of Fields that we want to display in the LibreGrid (these are the domain object properties and they must be named exactly the same or the code will not be able to find them).
- Header Text that we want to display.
That's it. Let's do it!!
First, take a look at the new HTML Input fields we are going to use when loading from a WebAPI.

Here's how we set it up and the results which will occur when you press the [Load Data] button.
I'm including the data so you can just copy / paste it into the live example at my web site or if you built the code locally.
https://swapi.dev/api/people // URL
["id","name", "height", "mass", "hair_color", "eye_color", "birth_year"] // fields
results // data name
["id","name", "height", "mass", "hair_color", "eye_color", "birth_year"] // headers

All the Functionality Works
Go ahead and add your editableIndexes, searchableIndexes, etc. and you'll see that all the functionality is there. It took me a lot of work to get to this generic thing, but it works quite well.
Bugs?
Yes, you'll surely find some bugs but it works quite well and most of the bugs you find will probably be enhancement type of things.
One More Interesting Piece of Functionality: numericSortIndexes
You may have noticed that there is one more piece of functionality we haven't looked at. It is this idea of numeric sort index. This just means that you will want to search some columns based upon numeric values.
Now that we have some good data, this will be easier to explain. The two fields, height and mass are numeric type of data, but if you add a sortIndex for them, they will currently be sorted alphabetically. Here, I'll show what I mean.
If you attempt to sort the data in the height field, it is sorted alphabetically, not numerically and as you can see, 150 and even 202 comes before 96 and that is incorrect.
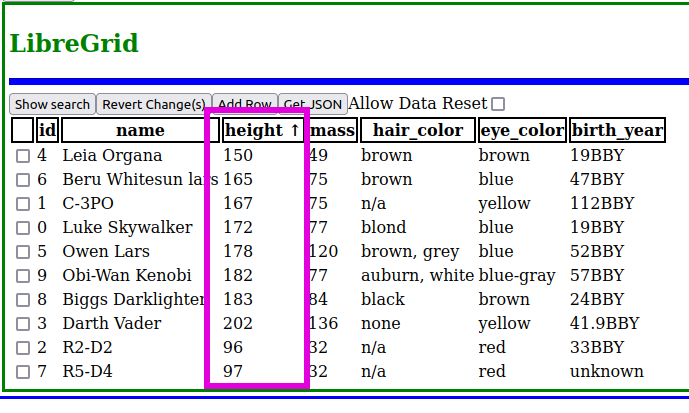
All we need to do is add a numericSortIndex for this field and the mass field and then they'll sort properly.
I actually add numericSortIndex for the ID, height and mass columns. Now, you can see that the sort is correct on the height column ascending.

That's all the functionality. There's lots more to talk about, but I'm going to post this article and see what you think. I'll post a second article very soon that displays how all of the data is passed into the constructor for the LibreGrid so you can know how to use it.
It'll look like the following. Take a look in the source code and see what you think.
<LibreGrid
          headers={JSON.parse(this.state.headers)}
          data={this.state.extra}
          fields={this.state.fields}
          numericSortIndexes={JSON.parse(this.state.numSortIndexes)}
          editableIndexes={JSON.parse(this.state.editableIndexes)}
          searchableIndexes={JSON.parse(this.state.searchableIndexes)}
          useLocalData={this.state.useLocalData}
        />
History
- 8th December, 2022: First publication