
Maani Chart Implementation Simplified for ASP.NET Applications
4.25/5 (6 votes)
Maani chart implementation for ASP.NET applications
Introduction
There are many animated flash charts available in the software industry. However, maani charts are a simple, yet powerful tool to create attractive charts and graphs from XML data; quick response to feature requests, clickable charts with editable links and drill-down and charts can be displayed inside another flash file.
Maani.Web Library
Maani.Web library helps to create the required XML data. It is built by a set of interfaces and filters. Filter defines any number of filters to enhance the look of or highlight different graphic elements. They are Bevel, Blur, Glow and Shadow. The XmlSerializer<T> class helps to serialize the generic collection object where the objects are encoded into XML.
Maani.Web library also helps to render XML data for composite and drill-down charts. However, clickable charts with editable links and drill-down charts require a license key which is domain specific. Look at composite and drill down charts samples in maani.us.
The demo application has two ASPX pages. One is specific to design page and the other is an XML data source page where the dynamic XML is being rendered. The design page Default.aspx has the following script that embeds the XML flash charts into web page.
if (AC_FL_RunContent == 0 || DetectFlashVer == 0) {
	alert("This page requires AC_RunActiveContent.js.");
} else {
	var hasRightVersion = DetectFlashVer(requiredMajorVersion,
				requiredMinorVersion, requiredRevision);
	if(hasRightVersion) {
		AC_FL_RunContent(
			'codebase',

'http://download.macromedia.com/pub/shockwave/cabs/flash/swflash.cab#version=9,0,45,0',
			'width', '700',
			'height', '480',
			'scale', 'noscale',
			'salign', 'TL',
			'bgcolor', '#ffffff',
			'wmode', 'opaque',
			'movie', 'charts',
			'src', 'charts',
			'FlashVars',

'timeout=36000&library_path=charts_library&xml_source=
	ChartDataSource/SampleDataSource.aspx?unique_id=',
			'id', 'my_chart',
			'name', 'my_chart',
			'menu', 'true',
			'allowFullScreen', 'true',
			'allowScriptAccess','sameDomain',
			'quality', 'high',
			'align', 'middle',
			'pluginspage', 'http://www.macromedia.com/go/getflashplayer',
			'play', 'true',
			'devicefont', 'false'
			);
	} else {
		var alternateContent = 'This content requires the Adobe Flash Player. '
		+ 'Get Flash.';
		document.write(alternateContent);
	}
}
The SampleDataSource.aspx page renders XML data. In this sample, GroupResult class that holds the custom data and the following script binds the data into a chart.
Chart chart = new Chart();
// Data Collection
List<groupresult /> list = new List<groupresult />(){
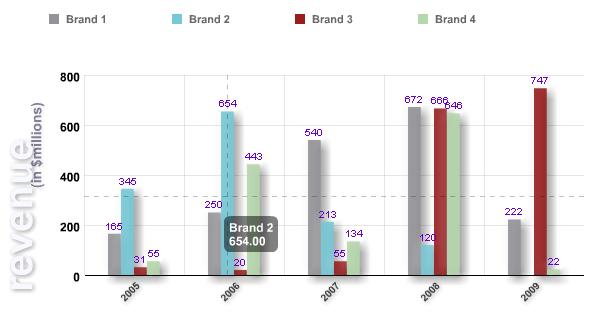
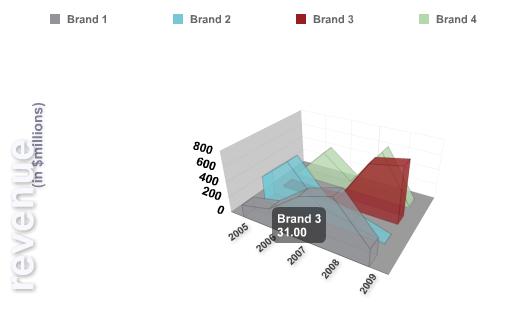
new GroupResult(){BrandName="Brand 1", Year =2005, Value=165},
new GroupResult(){BrandName="Brand 1", Year =2006, Value=250},
new GroupResult(){BrandName="Brand 1", Year =2007, Value=540},
new GroupResult(){BrandName="Brand 1", Year =2008, Value=672},
new GroupResult(){BrandName="Brand 1", Year =2009, Value=222},
new GroupResult(){BrandName="Brand 2", Year =2005, Value=345},
new GroupResult(){BrandName="Brand 2", Year =2006, Value=654},
new GroupResult(){BrandName="Brand 2", Year =2008, Value=213},
new GroupResult(){BrandName="Brand 2", Year =2009, Value=120},
new GroupResult(){BrandName="Brand 3", Year =2005, Value=31},
new GroupResult(){BrandName="Brand 3", Year =2006, Value=20},
new GroupResult(){BrandName="Brand 3", Year =2007, Value=55},
new GroupResult(){BrandName="Brand 3", Year =2008, Value=666},
new GroupResult(){BrandName="Brand 3", Year =2009, Value=747},
new GroupResult(){BrandName="Brand 4", Year =2005, Value=55},
new GroupResult(){BrandName="Brand 4", Year =2006, Value=443},
new GroupResult(){BrandName="Brand 4", Year =2007, Value=134},
new GroupResult(){BrandName="Brand 4", Year =2008, Value=646},
new GroupResult(){BrandName="Brand 4", Year =2009, Value=22}};
// Set x series labels
Row row = new Row();
chart.Data.Rows.Add(row);
row.XYSeriesMembers.Add(string.Empty);
foreach (var result in list.GroupBy(ac => ac.Year))
{
row.XYSeriesMembers.Add(result.Key.ToString());
}
foreach (var result in list.GroupBy(ac => ac.BrandName))
{
// Set y series labels
row = new Row();
row.XYSeriesMembers.Add(result.Key);
chart.Data.Rows.Add(row);
foreach (GroupResult groupResult in list.Where
(ac => ac.BrandName == result.Key))
{
// Set numeric values
NumericData data = new NumericData() { Bevel =
ChartUtilities.BEVEL_BACKGROUND, Shadow = ChartUtilities.SHADOW_LOW };
data.ToolTip = string.Format("{0}\n{1}", groupResult.BrandName,
((double)groupResult.Value).ToString("#,##0.00"));
data.Value = (double)groupResult.Value;
row.NumericData.Add(data);
}
}
chart.ApplyPredefinedFilters();
chart.ApplyPredefinedStyles(false);
// Set background styles
chart.Background.TextBackground[0].Value = "revenue";
chart.Background.TextBackground[1].Value = "(in $millions)";
// Set transition type.
// Valid values are dissolve, drop, spin, scale, zoom, blink,
// slide_right, slide_left, slide_up, slide_down, and none.
// The default is none, which draws the chart immediately without a transition.
// chart.Transition.TransitionType = TransitionType.slide_left;
// Set chart type
chart.Type = (ChartType)Enum.Parse(typeof(ChartType),
Session["chartType"].ToString(), true);
// Set chart styles
if (chart.Type == ChartType.Polar)
{
// Set circular area drawing style
chart.AxisCategory.Orientation = Maani.Web.Orientation.circular;
chart.Preference.Grid = GridStyle.circular;
}
else if (chart.Type == ChartType.Line)
{
// Show circle point labels
chart.Preference.PointShape = PointShape.circle;
chart.Guide.Radius = 5;
chart.Guide.RadiusColor = "FF0000";
}
else if (chart.Type == ChartType.Pie || chart.Type == ChartType.ThreeDPie)
{
chart.Preference.Selectable = true;
// Set labels style
chart.Label.ShowPercentage = true;
chart.Label.Positiion = LabelPosition.inside;
}
// write the chart xml string to the current HTTP output
Response.Write(chart.GetXml());
ApplyPredefinedFilters and ApplyPredefinedStyles methods apply set of pre defined filters and styles, and the styles and filters can be modified anywhere in code behind file.
public static void ApplyPredefinedStyles(this Chart chart, bool randomize)
{
    // Show as randomize colors or not
    if(randomize) chart.FillColors.Randomize();

    // Set label attributes for the category-axis.
    chart.AxisCategory = new AxisCategory() { Alpha = 75, FontSize = 10,
    	Orientation = Orientation.diagonal_up, Shadow = SHADOW_MEDIUM };

    // Set tick marks on the chart axis.
    chart.AxisTicks.ShowCategoryTicks = true;

    // Set label attributes for the value-axis.
    chart.AxisValue.Steps = 4;

    // Set background image
    chart.Background.ImageBackground.Add(new SizeableImageBackground()
    	{ ImageUrl = "images/blue_bg_lg.png", Height = 320 });

    // Set background text images
    chart.Background.TextBackground.Add(new TextBackground()
    	{ Shadow = SHADOW_MEDIUM, FontColor = "f8f8ff",
    	Alpha = 90, Rotation = -90, FontSize = 40, X = 0, Y = 400,
    	Width = 300, Height = 200, HorizontalAlignment = HorizontalAlignment.center });
    chart.Background.TextBackground.Add(new TextBackground()
    	{ Shadow = SHADOW_LOW, FontColor = "000033",
    	Alpha = 50, Rotation = -90, FontSize = 14, X = 15, Y = 330,
    	Width = 300, Height = 50, HorizontalAlignment = HorizontalAlignment.center,
    	VerticalAlignment= VerticalAlignment.middle });

    // Set chart's border attributes.
    chart.BorderThickness = new ChartBorder(0)
    	{ BorderColor = "000000", BottomThickness = 1 };

    // Set preferences for some charts.
    // Each chart type has different preferences, or no preferences at all.
    chart.Preference = new ChartPref()
    	{ PointShape = PointShape.none, FillShape = true, LineThickness = 3 };

    // Set the look of the series graphs of bar and column chart types
    chart.Series = new ChartSeries() { BarGap = 2, SetGap = 50 };

    // Set attributes of the labels that appear over the graphs
    chart.Label = new ChartLabel() { FontSize = 10, Alpha = 90,
    	FontColor = "6600CC", Positiion = LabelPosition.outside };

    // Set chart's rectangle
    chart.Rect = new ChartRect() { X = 90, Y = 110, Width = 600, Height = 250 };

    // Sets one or two guide lines to connect the
    // cursor position with the axes and simplify reading their values.
    chart.Guide = new ChartGuide() { ShowHorizontalGuide = true,
    	ShowVerticalGuide = true, Thickness = 1, Alpha = 25,
    	LineThickness = 2, LineAlpha = 50, Type = GuideLineType.dashed };

    // Set legend's attributes. The legend is the area that
    // identifies the colors assigned to the graphs
    chart.Legend = new Legend() { Alpha = 95, FontSize = 11,
    	FontBold = true, FontColor = "5f5f5f",
    	Margin = 5, Width = 640, Height = 70, X = 50, Y = 20,
    	Style = LayoutStyle.horizontal };

    // Set maani licence key
    chart.License = ConfigurationManager.AppSettings["MaaniLicense"];
}
If required, download the latest XML/SWF Charts, decompress the download package, and place the following files in the same directory:
- charts.swf
- charts_library
- AC_RunActiveContent.js
Screenshots


History
- 7th October 2009 - Initial release