
Create a SQL Pivot Table in Six Steps
3.67/5 (2 votes)
In this episode of SQL Minute I want to share with you how to create a pivot or cross tab chart.
In this episode of SQL Minute I want to share with you how to create a pivot or cross tab chart.
I’ll show you the steps using an example from the adventure works database. I get so many questions on how to create these!
Once you get the steps down, you’ll see they are not hard at all! I’ve seen where people get hung up in many ways, such as not knowing how to visualize the data, or write the SQL syntax.
By following my steps, we’ll overcome these hurdles and achieve success.
I want you to work along with me on this one, so think of a pivot table you want to create, as we’ll do it together.
Get your guide here:
Not that you have your guide, following along with the video!
How to Create a Pivot Table in Six Steps Transcript
Hi, this is Kris and welcome to another SQL Minute. In today’s episode, I’m going to share with you a guide I recently created, that shows you how to create a pivot table in six steps.
Many of you may not know what a pivot table is. It’s essentially, also known as a cross tab. And it’s a way of summarizing values by rows and columns, and it creates a chart. Usually when creating a pivot table, what I tell people is, first we got to state what our goal is.
So in my example, the goal that I’m going to aim towards, is to summarize parts located in a specific plant location. And summarize the quantity of those parts by production line.
Sketch the Pivot Table
And then what I did, is I sketched out what I wanted my pivot table to look like. So you can see using the Adventure Works data, what I came up with is I have my product lines. I wanted to have those as the columns.
I’m going to sum up the quantity of parts in the cells, think of this like a spreadsheet. And then the location name will be the individual rows of my pivot table. And this is just kind of helps visualize what I’d like to see for my data.
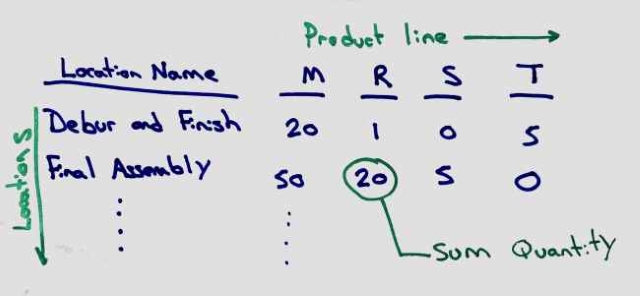
So when it comes your turn to create a pivot table, you can use this chart I put in the guide to help you understand what your columns would be, rows and what you’re summarizing.
Identify Source Data
In my mind, I think the hardest step in the pivot table, is actually identifying where the source of the data comes from. In my example, I’m actually pulling data from three different locations.
You can see here where I’m going to be pulling information more centrally from the product inventory to get the quantity, but I have a product ID and a location ID, which are just numbers and they’re not going to be fun to read, so I want to get the names of the location and of the product line.
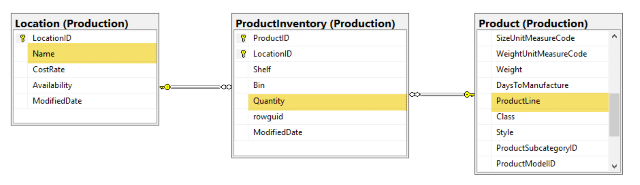
So to do this, I will incorporate joins and join in by primary key to get the location name, as well as the product line. The step I’m going to do here then, is to draw out the table relationships, understand what they are and then I’m going to go in and write a query just to get that data.
So what I mean by that is, is let’s just take this query here that I wrote. And I’m going to switch over to sequel server here and run it. Oops, I got to get the right database, hang on.
And you’ll see where I’m bringing in just un-summarized data. Here’s an entry in the database for where the inventory is in the tool crib. There’s 408 of them and it’s for a product line that’s null.
And as you move on through, you’re going to see more of this where it’s the location name, the quantity. But notice how there’s sub-assembly listed several times. And you’ll definitely see product line listed several times. So the data is not summarized. This just the raw data.
Get Pivot Table Source Data
But I really recommend doing this step because A, you’re going to need to have this query to do your pivot. And secondly, as an intermediate step, it allows you to look at your information to understand if you’re pulling the information incorrectly from the database, as well as to see if perhaps you’re doing a double count.
Because you don’t want to bring in duplicate rows, because when it gets time to summarize that information, all you’ll be doing is double counting values and your summary values will be off.
Determine Pivot Table Column Values
So once you have your query created, then the next step is to select the pivot columns. If you recall in my sketch, I wanted the location name to be the rows. So here’s the location name.
And then I had the product lines going across. When we’re writing the pivot query, the actual column name values, become column names, that’s why they’re in brackets.
So product line M is a value in our database, but when we select it from the pivot table, there’s actually going to be a column called M. So that’s why we’re selecting column M, R, S, T and then the dash they made for the null values.
Hint! Use SELECT DISTINCT to find Pivot Table Column Values
Now, if you’re having a hard time knowing what these values would be, a trick is to just come in and do a … SELECT DISTINCT on what your column values.
In this case, it would be product line. If I come back to my database here, throw up a new query, I’m going to paste this is. This joint is the same as it was in my original query. All I really did here is I stripped out the other columns when I select, and I just have a distinct cause now on the product line.
And when I run this, you’ll see that it’s bringing back the unique product line. So I know that these are the columns that I need to select in order to create that pivot table. And you’ll see these in my select statement. So if you just kind of keep in mind T, S, R, M and dash, you come back here, you’ll see T, S, R, M and dash.
So the idea here now is that we’re going to select these from our pivot table. And to do this, we just add this to the top of our original select statement. So this you should recognize in green.
This is what we originally created to get the information. Notice it’s now a drive table. It’s in brackets, or I’m sorry, parenthesis. And this becomes the first of the last step. Because after this, what we need to do is now generate the pivoted results.
And to do that, we will go to step six. And here we will add a pivot clause to the bottom of our query. Now, the pivot clause may look strange at first. Let me break it down for you.
Final Pivot Table Step
Essentially here we have the pivot clause, where we’re summing what we want to summarize. In our case, I want to add up the quantity of inventory.
The recall quantity was one of the columns I was selecting from that pivot data. And then, the other thing here is that you’ll see product line again, all right? So product line is the column that is used to drive the column values. And again, here’s our friends … the column values. So we’re basically telling it these are the specific column values that we want to bring back into our pivot table.
Three Parts to Pivot Table
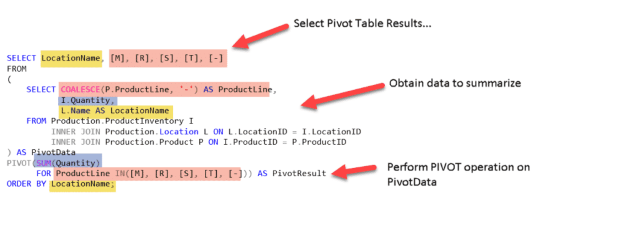
When all is said and done, this all gets put together and creates the overall pivot statement. So there’s the three pieces.
- There’s the piece where we’re selecting our rows and columns from the pivot table.
- There’s the piece where we’re actually going in and selecting the source data from the database with the joints.
- And the lastly, as we just went over, is the piece where we’re actually constructing the pivoted results.
And just to add a little flare to it all, I’m ordering the entire table by location name.
So this location name is part of this order clause right here, right? So we’re ordering that. To help out a little more, you can see where I created a little diagram, just to kind of show the pattern here where the yellow relates to location name, pink to the product lines and how it all relates through the queries to help you out.
So, this guide is available on the website at www.essentialSQL.com. It’s a downloadable PDF that you can use to work through your own examples.
If you don’t have an example and you want to work through mine, that’s great. Also, what I did here at the top is provided some other examples from the Adventure Works database that you can try on your own. I recommend doing that. Practice is definitely essential when you are trying to learn SQL.
Go to www.essentialSQL.com and pick up this free guide. I’ll talk to you later.
The post Create a SQL Pivot Table in Six Steps appeared first on Essential SQL.