Introduction
Who likes to see an unkempt room? A street littered with garbage? A smelly toilet?
Who likes to see objects go undisposed in managed code?
Hopefully, no one.
Non-deterministic garbage collection in .NET makes it your responsibility to dispose objects, and bad things can happen if you don't do that. Besides the cost of finalization, your application could run out of resources and crash if it happens to consume them in a way that doesn't trigger garbage collection.
But, this article isn't about why you need to call Dispose - it assumes you've already seen The Light. This article is about ways to find objects that did not get disposed.
Techniques
The simplest way to find undisposed objects is to add some logging to the finalizer of each disposable type. Running the application through typical scenarios and checking the logs should tell you which types are not being disposed. If you know how to use Windbg and SOS, you can also use the !finalizequeue extension command to view all finalizable types. If the list of finalizable types is small, you can go through your code, looking for missing Dispose calls on instances of those types.
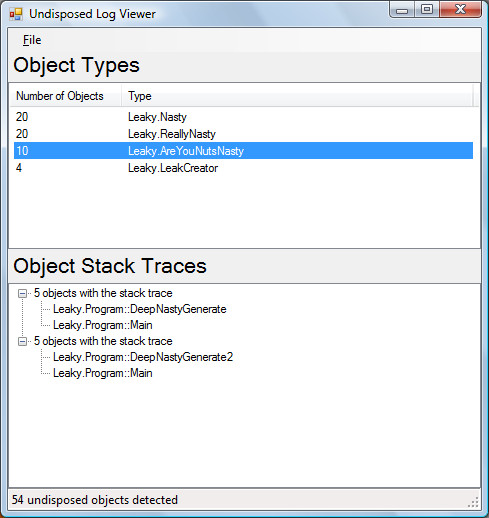
Neither approach works well when there is a huge code base, or if there are third party libraries involved. Enter Undisposed, the subject of this article. It's an application I wrote that uses the CLR profiling API to monitor finalizations and object creations at runtime, and shows you all finalized objects, with stack traces for the respective constructors to help you quickly pinpoint the offending section of code. Here's how the result of the analysis looks:

The top panel shows you the number of finalized objects by type, and the bottom panel shows unique stack traces of constructors for the selected type.
How To Use It
Download the application and register Undisposed.dll using:
regsvr32 Undisposed.dll
The DLL requires VC redistributable for VS 2008 SP1, so if registration fails, please install the redistributable from here.
Launch UndisposedViewer.exe:

Enter the path of the application to launch, command line arguments (if any), and a log file location. Click on "Automatically find finalizable types" to search for all finalizable types in the application. You can also enter the type names manually. The list of types in the textbox at the bottom will be the ones that will be monitored for finalization. Hitting Go will launch the target application. Put the application through its paces, and once you exit the application, Undisposed LogViewer will launch automatically, showing you the undisposed objects in that specific run of the application.
How It Works
Undisposed.dll
The key component in this application is Undisposed.dll - a COM component that hooks up with the CLR profiling API. In a throwback to old times, the CLR relies on plain old environment variables to know what profiler to load. The "COR_ENABLE_PROFILING" environment variable tells the CLR that profiling is enabled, and it reads the "COR_PROFILER" environment variable to get the CLSID of the component to be loaded as the profiler.
The CLR Profiling API exposes a ICorProfilerCallback2 interface which must be implemented by the COM component. Once loaded, the CLR calls back into the component using methods on that interface. There are a lot of methods there, but these are the ones Undisposed uses.
Initialize - Initializes all trackers Shutdown - Shuts down all trackers FinalizeableObjectQueued - Notifies the finalization tracker, which writes out the details to logObjectAllocated - Notifies the object tracker, which maps objects with the stack trace obtained by walking the stack SurvivingReferences - Notifies the object tracker about objects that survived a garbage collection MovedReferences - Notifies the object tracker about objects that were moved during a garbage collection
The Initialize callback is also used to get an interface pointer to ICorProfilerInfo. The SetEventMask method on that interface is used to tell the CLR the events that the profiler is interested in. For Undisposed, they are:
hr = m_pCorProfilerInfo->SetEventMask(COR_PRF_MONITOR_CLASS_LOADS
        | COR_PRF_MONITOR_OBJECT_ALLOCATED
        | COR_PRF_MONITOR_GC
        | COR_PRF_ENABLE_OBJECT_ALLOCATED
        | COR_PRF_ENABLE_STACK_SNAPSHOT
        )
The COR_PRF_ENABLE_STACK_SNAPSHOT lets the profiler walk the stack using ICorProfilerInfo2::DoStackSnapshot. This is used to get the constructor stack trace for the object the profiler is tracking.
There are lots of other interesting implementation details, enough to warrant a separate article. At a high level though, this is how the code is organized:

The Controller forwards calls from the CLR to the appropriate tracker objects. ObjectTracker maintains the list of live objects of all monitored types, along with the stack trace of their constructors. It also does the book keeping after a garbage collection is done. FinalizerRunLogger writes out the object type and the stack trace when it gets notified that an object of one of the monitored types is about to be finalized. TypeTracker, not shown above, maintains a map from the internal data structures to the type names.
UndisposedViewer.exe
The main application merely launches the target application after setting up the environment variables to load Undisposed.dll. It also writes its current state to a config file that is then read by the COM component. This is needed to pass things like the list of types to monitor.
UndisposedLogViewer.exe
The log viewer is launched after the target application exits. There is not much logic in there, it simply reads the log file generated by Undisposed.dll and shows the data grouped by type and stack trace.
Conclusion
The inspiration for writing this application came from this post in the Lounge. Hopefully, it will prove useful to you as well. Feedback and suggestions are welcome.
History
- 20-07-2009 - Initial version
- 13-08-2009 - Updated source code and binaries
