Intel® Parallel Studio XE has tools that cover all aspects of code tuning on Intel® hardware. Sometimes it’s hard to know which tool to start with, so the Intel® VTune™ Amplifier Application Performance Snapshot (APS) is a good way to get a quick summary of your application’s performance characteristics―particularly the bottlenecks limiting performance. Let’s look at how the tools help to find bottlenecks and improve the performance of an example code.
High-performance computing (HPC) systems are a complex combination of hardware components. And hardware vendors are constantly working to increase speed, reduce latency, add cores, and make vectors longer to improve the performance of compute-intensive applications. But simply running an application on a system with better components doesn’t guarantee those components will be used efficiently. Getting the expected performance boost may still take code modifications.
Fortunately, Intel® Parallel Studio XE has tools that cover all aspects of code tuning on Intel® hardware. Sometimes it’s hard to know which tool to start with, so the Intel® VTune™ Amplifier Application Performance Snapshot (APS) is a good way to get a quick summary of your application’s performance characteristics―particularly the bottlenecks limiting performance. You can use the snapshot to select the right Intel Parallel Studio XE tool to tune cluster-, node-, and/or core-level performance (Figure 1).
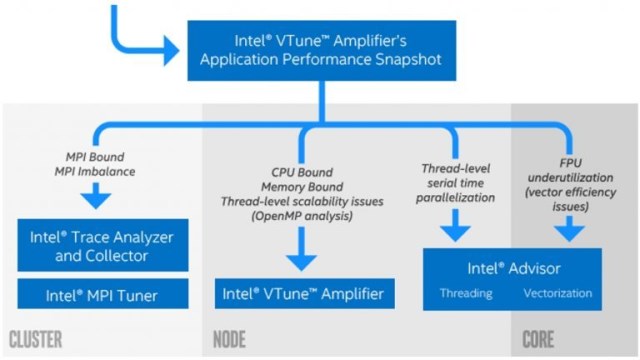
Figure 1 – APS and specialized performance tools
Iso3DFD*: A Wave Propagation Kernel and its Performance Measurement
Let’s look at how the tools help to find bottlenecks and improve the performance of an example code. Iso3DFD implements the isotropic acoustic wave equation:

where ∇2 is the Laplace operator, p is the pressure field, and c is the velocity field. Finite differences can be used to express pt+1 as a function of pt and pt-1. Implementing a finite difference propagation kernel can be done with a stencil pattern. In three dimensions, a stencil looks like a 3D cross that we move across the pressure field. In other words, to update pt+1[x,y,z], we need to access all the neighbors of pt[x,y,z] in 3D. Figure 2 demonstrates the stencil pattern in 2D.
Figure 2 – A 2D stencil pattern
In a real-world application, physicists usually implement a specific propagation methodology for corner cases. These corner cases are called boundary conditions. To keep the code simple in this example, we don’t propagate the wave on the borders. The straightforward implementation in Figure 3 computes a single iteration of the stencil.
Figure 3 – Computing a single iteration of the stencil
Because this article will focus on single-node performance, the example code will not use MPI to implement cluster-level parallelism. To establish baseline performance, we benchmarked the initial implementation using a 512 x 400 x 400 grid running on a dual-socket Intel® Xeon® Gold 6152 processor (2.1 GHz, 22 cores/socket) system (Red Hat Enterprise Linux Server* 7.4). Use this command to set up the Intel Parallel Studio XE environment:
> source <Parallel_Studio_install_dir>/psxevars.sh
Let’s use Intel VTune Amplifier’s Application Performance Snapshot to quickly find tuning opportunities in the initial Iso3DFD implementation. This command invokes APS:
> aps ./Iso3DFD
Figure 4 shows the APS report that appears in a Web browser. Of course, the initial single-threaded version of the application only uses one of the 44 physical cores on the system. This was recognized by APS as the major performance opportunity, so let’s parallelize the code.
Figure 4 – APS report for the original single-threaded code
Optimization Step 1: Introducing Thread-Level Parallelism with OpenMP*
There are no dependencies in the loops, so let’s do a straightforward parallelization using the OpenMP* “parallel for” pragma on the outermost loop because it has the most work per iteration (Figure 5).
Figure 5 – Parallelization using the OpenMP “parallel for” pragma on the outermost loop
Doing a quick check with APS shows that elapsed time has significantly improved (Figure 6). The snapshot reports some load imbalance in the OpenMP, but a speedup of approximately 38x is a good start. The more pressing performance issue is that the application is memory-bound. We need to improve memory access to remove this bottleneck.
Figure 6 – APS report after parallelization with OpenMP
Optimization Step 2: Using Loop Interchange to Improve Memory Access
Memory stalls due to suboptimal memory access are now the major bottleneck in our application, so let’s run an Intel VTune Amplifier Memory Access Analysis, as advised in the APS hints (Figure 6):
> amplxe-cl –collect memory-access ./Iso3DFD
The analysis results are shown in Figure 7. The application is DRAM-bound, but memory bandwidth consumption is far from its limit (i.e., the DRAM Bandwidth Bound value is small). This is typical for applications that access memory with long stride. The Intel® Advisor Check Memory Access Patterns analysis can help us to detect which lines of code are causing the problem (Figure 8).
Figure 7 – Intel VTune Amplifier Memory Access Analysis summary
Figure 8 – Intel Advisor Memory Access Pattern Analysis
A stride of 204,800 is exactly the size of our first two dimensions (512 x 400). This means that iteration by array elements in the innermost loop is not using the processor cache efficiently. We can fix this by changing the loop order (Figure 9).
Figure 9 – Changing the loop order
With this change, access to array elements in the innermost loop will be contiguous in memory, which should increase cache reuse. Let’s recompile and get another performance snapshot with APS (Figure 10). According to the report, we got a speedup of approximately 4.7x by optimizing memory access. The percentage of memory stalls is significantly lower and the application is no longer DRAM-bound. However, the OpenMP Imbalance reported previously in Figure 6, and again in Figure 10, is now the main performance problem.
Figure 10 – APS report after loop interchange
Optimization Step 3: Improving Load Balance with OpenMP Dynamic Scheduling
Even though we still have memory stalls, APS draws our attention to the OpenMP Imbalance, which accounts for 30% of elapsed time. OpenMP does static scheduling by default. This is generally an effective, low-overhead scheduling protocol. However, it can sometimes cause load imbalance, so let’s try dynamic scheduling (Figure 11) instead.
Figure 11 – OpenMP dynamic scheduling
This significantly relieves the load imbalance (Figure 12).
Figure 12 – APS report after applying dynamic scheduling
Optimization Step 4: Improving Memory Access Using Cache Blocking
Because cache stalls are still significant (Figure 12), we can try to optimize data reuse in the cache by implementing a well-known optimization called cache blocking (Figure 13).
Figure 13 – Cache blocking
Please note that to feed OpenMP threads with parallel work, we added the collapse(3) clause to our omp parallel for pragma so that the three loops arranged for blocking will be collapsed into one large iteration space. The new APS shows a 1.3x improvement with fewer memory stalls and better OpenMP load balance as a result of cache blocking (Figure 14).
Figure 14 – APS report after cache blocking
Optimization Step 5: Introducing Vectorization
From the APS report, we can see that our compute kernel contains only scalar floating-point instructions (the “% of Scalar FP Instr.” value is 100%). This means that the code was not automatically vectorized by the compiler. Let’s use Intel Advisor to explore opportunities to vectorize the code:
> advixe-cl –collect survey ./Iso3DFD
Opening the report in the GUI and looking at the Survey and Roofline tab, we can see that the tool advises us to apply a SIMD directive to help the compiler vectorize the highlighted loop (Figure 15).
Figure 15 – Intel Advisor points to an opportunity for loop vectorization
The OpenMP standard recently added the omp simd pragma to help compilers do automatic vectorization when they can’t determine if loop iterations are independent. So let’s insert the pragma and see if it helps (Figure 16).
Figure 16 – Inserting the omp simd pragma
Recompile the application with the –xHost compiler option to use the proper vector instruction set. The APS report now shows a 2x performance improvement (Figure 17). Also, we can see that the vector capacity usage is at 50%. As we improved vectorization efficiency, however, we see that there’s now high pressure on the memory. We need to bring in much more data than before to feed the vector units, which is why we see memory stalls again.
Figure 17 – APS report after vectorization
Threading, Memory, and Vectorization Optimizations
We could try further optimizations (e.g., using the -qopt-zmm-usage=high compiler option), but we’ve gone from a baseline performance of 1,767 seconds down to 3 seconds with just a few basic code modifications and effective use of Intel Parallel Studio XE, particularly APS. APS was helpful to quickly check optimization progress and identify tuning opportunities. Intel VTune Amplifier’s Memory Access analysis and Intel Advisor’s Survey and Memory Access Patterns helped with deeper analysis of particular performance aspects.
Learn More
Software and workloads used in performance tests may have been optimized for performance only on Intel microprocessors. Performance tests, such as SYSmark and MobileMark, are measured using specific computer systems, components, software, operations and functions. Any change to any of those factors may cause the results to vary. You should consult other information and performance tests to assist you in fully evaluating your contemplated purchases, including the performance of that product when combined with other products. For more complete information visit http://www.intel.com/performance.
Intel’s compilers may or may not optimize to the same degree for non-Intel microprocessors for optimizations that are not unique to Intel microprocessors. These optimizations include SSE2, SSE3, and SSSE3 instruction sets and other optimizations. Intel does not guarantee the availability, functionality, or effectiveness of any optimization on microprocessors not manufactured by Intel. Microprocessor-dependent optimizations in this product are intended for use with Intel microprocessors. Certain optimizations not specific to Intel microarchitecture are reserved for Intel microprocessors. Please refer to the applicable product User and Reference Guides for more information regarding the specific instruction sets covered by this notice.
You may know us for our processors. But we do so much more. Intel invents at the boundaries of technology to make amazing experiences possible for business and society, and for every person on Earth.
Harnessing the capability of the cloud, the ubiquity of the Internet of Things, the latest advances in memory and programmable solutions, and the promise of always-on 5G connectivity, Intel is disrupting industries and solving global challenges. Leading on policy, diversity, inclusion, education and sustainability, we create value for our stockholders, customers and society.


 General
  News
News  Suggestion
  Question
  Bug
Bug  Answer
  Joke
Joke  Praise
  Rant
Rant  Admin
Admin 


