Introduction
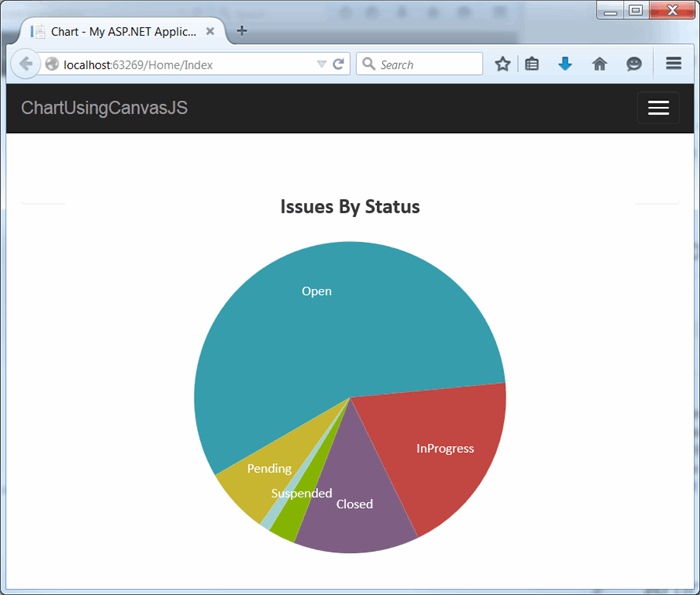
Showing data in graphical formats such as chart or graph is an important means of communication to get the ideas across. Top management within the organization always wants to see summarized information like charts or graphs rather that the raw data. In this short tip, I will show how to create a Pie graph for a hypothetical issue tracking system.
Background
Drawing charts/graphs in MVC application has been made easy with the JavaScript pakage called CanvasJS. In this demo, I have an MVC model to send the data to the view and in the view, I have I used CanvasJS to draw the chart.
For the demo, I have used Visual Studio 2013 and MVC 5.
Using the Code
I have created a new Web Site project. As the default project has all the necessary packages except the CanvasJs, so I have added the canvasjs.min.js to my scripts folder.
Note: Currently CanvasJS is available with TypeScript in nuget library.
I have added the following class for the data:
public  class Status
    {
        public int Open { get; set; }
        public int InProgress { get; set; }
        public int Closed { get; set; }
        public int Suspended { get; set; }
        public int Referred { get; set; }
        public int Pending { get; set; }
    }
The view for the Chart is as below:
@model ChartUsingCanvasJS.Models.Status
@{
ViewBag.Title = "Chart";
}
<h3>@ViewBag.Message</h3>
<div class="panel">
<div class="panel-heading">
</div>
<div class="panel-body">
<form class="form-horizontal container" role="form">
<div class="form-column col-lg-12 col-md-12 col-sm-12">
<div class="col-12 dashboard">
<div class="row">
<div class="col-md-12">
<div id="IssueStatus" class="chart small"></div>
</div>
</div>
</div>
</div>
</form>
</div>
</div>
<script src="~/Scripts/canvasjs.min.js"></script>
<script type="text/javascript">
var issueStatus = new CanvasJS.Chart("IssueStatus", {
data: [
{
showInLegend: false,
indexLabelFontSize: '14',
indexLabelFontColor: 'white',
startAngle: 150,
indexLabelPlacement: "inside",
toolTipContent: "{name}: {y} issues",
type: "pie",
dataPoints: [
{ y: '@Model.Open', indexLabel: 'Open', name: 'Open' },
{ y: '@Model.InProgress', indexLabel: 'InProgress', name: 'InProgress' },
{ y: '@Model.Closed', indexLabel: 'Closed', name: 'Closed' },
{ y: '@Model.Suspended', indexLabel: 'Suspended', name: 'Suspended' },
{ y: '@Model.Referred', indexLabel: 'Referred', name: 'Referred' },
{ y: '@Model.Pending', indexLabel: 'Pending', name: 'Pending' }
]
}
],
title: {
text: "Issues By Status",
fontSize: "22"
},
legend: {
fontFamily: "Arial",
fontSize: 14
},
creditHref: "",
backgroundColor: "white"
});
issueStatus.render();
</script>
The controller methods that send the model to the view are as below:
public class HomeController : Controller
{
public ActionResult Index()
{
Status status = new Status();
status.Open = 100;
status.InProgress = 34;
status.Closed = 23;
status.Pending = 12;
status.Suspended = 5;
status.Referred = 2;
return View(status);
}
}
Points of Interest
History
- 29-05-2015: Initial submission
Next
I will do other types of graphs using MVC frameworks in future.
This member has not yet provided a Biography. Assume it's interesting and varied, and probably something to do with programming.


 General
  News
News  Suggestion
  Question
  Bug
Bug  Answer
  Joke
Joke  Praise
  Rant
Rant  Admin
Admin 


