Introduction
If you are working with languages like Python and/or using tools like TensorFlow or MatLab, then there are a variety of tools or ways to obtain “evaluation metrics” when performing binary or multi-classification training of neural nets, svms, logistic regressions, or decision forests, etc. If you use tools like SPSS or SAS, obtaining crosstabulations and related statistics is also easy. But when you want to use C#, as often is the case, you need to build your own method.
For C# AI and statistical work, I’ve had good success with the free (but unthreaded) version of ALGLIB, which has fairly good and relatively simple-to-use tools for building and training neural nets and decision forests and for using those trained networks in other C# applications to classify new data. However, I wanted to be able to visualize the results in ordinary crosstabs or “confusion matrix” format. So this CodeProject article presents and describes a method I found useful and wanted to share.
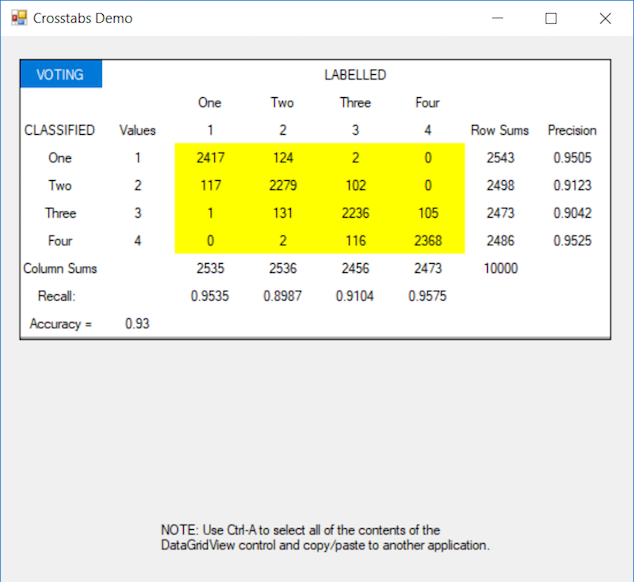
Given two lists, one a list of the “supervised” or “labelled” values used for training and the second a list of the classifications produced by applying the trained network to the same “features” data, along with options for supplying nice variable and value labels, this Crosstabs() method will return a nice “confusion matrix” (a square crosstabs plus a column for row precision and a row for column recall values, plus an overall accuracy), either as text output to the console (as shown below) or as a populated DataGridView control for use in a form (as shown above).
Using the Code
The CrosstabsDemo runs a winform that contains a datagridview control. The Form1.cs code (partially shown below) creates a list (named LabelledData) of NofCases = 10,000 for a variable (say, VOTING) that uniform randomly assumes NofStates = 4. Pretend that this is the supervised or labelled criterion data used for training or validating a network.
using System;
using System.Collections.Generic;
using System.Windows.Forms;
namespace CrosstabsDemo
{
public partial class Form1 : Form
{
public static Random Rand = new Random(0);
public Form1()
{
InitializeComponent();
int NofCases = 10000;
int NofStates = 4;
List<int> LabelledData = new List<int>();
List<int> ClassifiedData = new List<int>();
for (int i = 0; i < NofCases; i++)
{
int avalue = Rand.Next(1, NofStates+1);
int pvalue = avalue + (int)RandomGausian(0, .6);
if (pvalue > NofStates) pvalue = NofStates;
if (pvalue < 1) pvalue = 1;
LabelledData.Add(avalue);
ClassifiedData.Add(pvalue);
}
Dictionary<int, string=""> RowValueLabels = new Dictionary<int, string="">()
{
{ 1,"One" }, { 2,"Two" }, { 3,"Three" },{ 4,"Four" },{ 5,"Five" }
};
Crosstabs ct =
new Crosstabs(ClassifiedData, LabelledData, tablelabel: "VOTING");
ct.RowLabels = RowValueLabels;
ct.ColumnLabels = RowValueLabels;
ct.WritetoConsole();
ct.View(dataGridView1);
}
......
}
}
Next, it creates a second list (named ClassifiedData) that contains a bit of added-in error to simulate the results of applying the trained network to the feature data (used for training) and getting back the network’s predicted classifications. (Or, of course, these lists might simulate a validation data set.)
These two lists are the inputs for the Crosstabs object’s constructor method (along with maybe a criterion variable name like VOTING). The initial Crosstabs object (named ct in the demo) is a simple numerical integer array [,] which you can retrieve using the ct.GetTableArray property.
Optionally, for more readable output, you can add row and column value labels using the ct.RowLabels and ct.ColumnLabels properties. (If you add fewer row or column labels, than there are distinct state values, remaining labels will be padded as empty strings. If you add more labels than values, those will be ignored.)
Then you can write as text, a nicely formatted results table to the console window (probably just for testing) by calling the ct.WritetoConsole() method, as shown below. Or better (when using a form), by supplying the name of the Form1.datagridview control to the ct.View() method, you get a more attractive output visualization of the crosstabs/confusion matrix results, as shown above. Either output is easy to copy and paste into other documents.

Points of Interest
There is little, if any, clever programming involved here, but this sort of tool has been very useful in my work for visualizing the results of AI trainings and validations using C#. I hope readers may find it useful directly or with minor modifications and/or additions for similar needs. For example, if you just want crosstabs (with a square or rectangular grid), this method will do that. If you want other statistical tests (Chi Square, F-ratio, etc.), they would be simple to add.
History
- 13th November, 2017: Original article
- 18th November, 2017: Update
- Redesigned crosstabs.cs to correct issues when the crosstabs or confusion matrix is rectangular: e.g., if a trained model does not classify any cases for some labelled values. Changed the type for row and column value labels from
List<string> to Dictionary<int><string>.


