Click here to Skip to main content
15,881,757 members
Everything / General Programming / Debugging

Debugging

debugging

Great Reads

by PJ Arends
Trace your function calls to the Output window.
by Giovanni Scerra
Patterns to prevent null reference exceptions
by Maxim Kartavenkov
The series of articles covers most aspects of logging and tracing mechanisms which can be embedded into your application. It discusses simple ways of tracing and also new tracing technologies which were involved in Windows 10.
by David A. Gray
Historically, ETW has been portrayed as having a very steep learning curve, along the lines of the effort required to summit Everest. Realizing its potential value, I set about to reduce the effort to that required to summit Pike's Peak.

Latest Articles

by PJ Arends
Trace your function calls to the Output window.
by Maxim Kartavenkov
Discussion of how to organize saving application trace helper information.
by Maxim Kartavenkov
Continue discussion of the simple kernel drivers tracing mechanisms by using output information into the handles of the files pipes and console passed to the driver from the host application.
by Maxim Kartavenkov
Discussion of simple ways of tracing and also new tracing technologies involved in Windows 10

All Articles

Sort by Score

Debugging 

U 9 Apr 2024 by PJ Arends
Trace your function calls to the Output window.
4 Feb 2012 by Huisheng Chen
Using reflection to dynamically verify if an assembly is in debug or release compilation
16 Sep 2015 by mudasser ajaz
How to debug ionic Android application in development phase
26 Feb 2012 by Raheel12345
How to attach all w3wp.exe processes to debugger with single click.
14 Aug 2019 by DaveAuld
Object inspection with %O in the console output
26 May 2011 by #realJSOP
When all else fails, fire off some events and bask in the glow of the IDE's Progress tab.
30 Sep 2011 by Daniele Rota Nodari
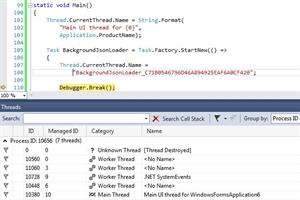
I was glad to integrate your code into my C# application.Actually, within the debugger windows, I can't recognize any human-readable reference to the calling process, but the function is working. :)So, for whoever may be interested, the following code is my C# 4 equivalent:using...
17 Oct 2019 by VipinMittal18
How to enable debugging in Twig templates - Drupal 8
11 Jul 2011 by Kári Poulsen
Allows you to very easily see live trace output on any machine.
9 Nov 2012 by mlzg4
This stream implementation is fast, thread-safe, easy to use, and very useful for debugging large distributed or concurrent projects.
7 May 2021 by Marcell Lipp
Git used for debugging
20 Apr 2010 by elad2109
New feature I have recently found out-After toggle a breakpoint in VS2010 you can right click on it and change it to a tracepoint (only prints logs when access though it) or add filters for example: breaks the execution only for a specific thread.
1 Jun 2010 by AndreBroz
How to debug DirectShow
24 Jan 2012 by Gil Yoder
Visual Studio 2010 has a new visualizer for WPF that exposes a dependency object's visual tree.
16 Feb 2013 by Nitin_Garg
Macro to attach visual studio debugger to w3wp apppool hosting your webservice.
2 Feb 2015 by Michael Collins - Intervalia
Use the code below to determine the number of bindings of your Angular apps
19 May 2020 by Marcell Lipp
A proof introduction to Git blame and Git bisect
9 Nov 2017 by yuvalsol
Print DataTable, DataView, DataSet, DataRow[] to Console, StringBuilder or Stream
31 Aug 2013 by Michael Engstler
This tip is about how to setup Kernel-Mode Debugging in a VM using Visual Studio 2012.
30 Nov 2009 by Sohel_Rana
Sometimes you need to debug an application in a point where it’s difficult to attach debugger manually. For applications which you can’t run directly from Visual Studio (say windows service), you usually use attach process to visual studio to debug. So if you have a windows service running (with...
16 Jun 2011 by Karthik. A
Debugging ASP.NET MVC routes simplified using "Route Debug"
27 Jul 2011 by Octopod
An easy way to trap all the memory leaks of your application.
28 Apr 2018 by Eddy Vluggen
You've been taught to give every component and variable a descriptive name; why do most then don't do it for a thread, when it is easy and beneficial?
4 Apr 2011 by Adil Mughal
Demonstrate the functionality provided by Debug class in .NET
23 Sep 2015 by Bartlomiej Filipek
By default, Visual Studio (up to VS 2013) uses additional debug heap that slows down applications, even in Release mode. Read what you can do about this.
10 Oct 2013 by Rion Williams
This post will provide a short walk-through for handling and updating these areas of your application to gain more control over debugging, testing and running your applications through Visual Studio.
4 Dec 2011 by GuruprasadV
Check if dependency of a table are objects referenced by a stored proc. A system table with CTE can help to identify dependency quickly.
22 Jun 2015 by Sebastian Solnica
This post is the second and final one dedicated to debugging .NET Windows services.
1 May 2010 by Ajay Vijayvargiya
This feature may not seem useful initially, and might appear distracting you. But it is one of the very useful (new) features in Visual Studio 2010. You'll love it after using it for a while!While debugging, you typically put some variables in Watch Window (or use Locals, Autos etc). When...
20 Nov 2015 by borchef
This is the introduction to a series of articles about Modulair JavaScript.
26 Jan 2012 by Lakamraju Raghuram
For Visual Studio IDE we can detect leaks by using CRT debugger functions#define _CRTDBG_MAP_ALLOC#include #include void main(){ // ...... // ...... _CrtDumpMemoryLeaks();}This will dump leaks if any to the Output window. Check this link :...
6 May 2010 by TheyCallMeMrJames
When you hover over a variable with the debugger running you will see a thumbtack that allows you to pin the variable to the editor window. This is cool for a number of reasons.1) It is much easier to see changes to a set of variables in any kind of a loop construct. You can even pin...