Introduction
One of the main reasons for using .NET Core is that you can run it on multiple platforms and architectures. So you can build an application on one platform and run it on Windows, Linux, MacOS, and on different architectures like x86 and ARM. In this article, I will demonstrate how to create a cross-platform stock chart application using the ASP.NET Core (2.0) MVC and RESTful API.
API controllers in ASP.NET Core are like regular controllers, except that the response produced by their action methods are data objects that are sent to the client without HTML markup. The most common approach for delivering data from an application is to use the REST pattern. The core premise of a RESTful web API is to embrace the characteristics of HTTP so that request methods specify an operation for the server to perform, and the request URL specifies one or more data objects to which the operation will be applied.
In the following, I will use ASP.NET Core MVC, RESTful API and Google Charts to create a stock chart application. ASP.NET Core MVC provides the foundation for creating cross-platform web applications, RESTful API controllers provides access to data on the server, while Google Charts API provides a chart library that allows us to render the stock charts on the client side.
Access Stock Data Using API Controller
First, open Visual Studio 2017, start with a new ASP.NET Core (2.0) MVC project, and name it NetCoreStockChart. Add a new NuGet package named YahooFinanceApi to the project. This package will be used to retrieve the historical (daily, weekly, and monthly) stock data from Yahoo Finance.
Add a new class named StockPriceModel to the Models folder. Here is the code for this class:
namespace NetCoreStockChart.Models
{
    public class StockPriceModel
    {
        public string Ticker { get; set; }
        public string Date { get; set; }
        public decimal Open { get; set; }
        public decimal High { get; set; }
        public decimal Low { get; set; }
        public decimal Close { get; set; }
        public decimal AdjustedClose { get; set; }
        public decimal Volume { get; set; }
    }
}
Now, add an API controller named ApiStockDataController to the Controllers folder and replace its contents with the following code:
using Microsoft.AspNetCore.Mvc;
using NetCoreStockChart.Models;
using System;
using System.Collections.Generic;
using System.Threading.Tasks;
using YahooFinanceApi;

namespace NetCoreStockChart.Controllers
{
    [Produces("application/json")]
    public class ApiStockDataController : Controller
    {
        [Route("~/api/ApiStockData/{ticker}/{start}/{end}/{period}")]
        [HttpGet]
        public async Task<List<StockPriceModel>> GetStockData(string ticker, string start,
            string end, string period)
        {
            var p = Period.Daily;
            if (period.ToLower() == "weekly") p = Period.Weekly;
            else if (period.ToLower() == "monthly") p = Period.Monthly;
            var startDate = DateTime.Parse(start);
            var endDate = DateTime.Parse(end);

            var hist = await Yahoo.GetHistoricalAsync(ticker, startDate, endDate, p);

            List<StockPriceModel> models = new List<StockPriceModel>();
            foreach (var r in hist)
            {
                models.Add(new StockPriceModel
                {
                    Ticker = ticker,
                    Date = r.DateTime.ToString("yyyy-MM-dd"),
                    Open = r.Open,
                    High = r.High,
                    Low = r.Low,
                    Close = r.Close,
                    AdjustedClose = r.AdjustedClose,
                    Volume = r.Volume
                });
            }
            return models;
        }
    }
}
This API controller allows you to access the historical (daily, weekly, or monthly) stock data. Now, running this project, type in the following URL in the address bar of your browser:
http://localhost:63930/api/apistockdata/ibm/2018-01-01/2018-02-01/daily
and hit ENTER key, you will get the EOD (end of the day) stock data for IBM, as shown in Figure 1.
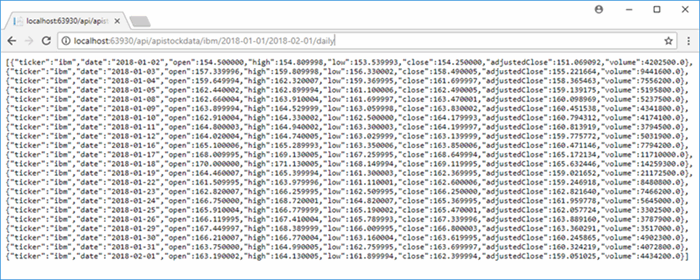
Figure 1: Stock data for IBM retrieved from a RESTful API controller.
Of course, you can also use the regular controllers to access the stock data. However, this method has serious deficiencies with regard to speed, efficiency, and openness.
Create Stock Charts
In this section, we will use Google Charts API and the stock data from API controller to create stock charts.
Add the following method named StockChart to the HomeController:
public IActionResult StockChart()
{
    return View();
}
Right click this method and select Add View... - this will add a view named StockChart.cshtml to the project. Replace its content with the following code:
<div id="div" class="row" style="padding:20px;">
    <div class="col-md-3">
        <div class="row form-group form-inline" style="margin-top:5px">
            <label class="col-sm-5 control-label" for="ticker">Ticker:</label>
            <div class="col-sm-7">
                <input id="ticker" type="text" class="form-control input-sm"
                       style="height:25px;width:100%" value="SPY" />
            </div>
        </div>
        <div class="row form-group form-inline" style="margin-top:-5px">
            <label class="col-sm-5 control-label" for="startDate">Start Date:</label>
            <div class="col-sm-7">
                <input id="startDate" type="text" class="form-control input-sm"
                       style="height:25px;width:100%" value="2016-01-01" />
            </div>
        </div>
        <div class="row form-group form-inline" style="margin-top:-5px">
            <label class="col-sm-5 control-label" for="endDate">End Date:</label>
            <div class="col-sm-7">
                <input id="endDate" type="text" class="form-control input-sm"
                       style="height:25px;width:100%" value="2018-01-01" />
            </div>
        </div>
        <div class="row form-group form-inline" style="margin-top:20px">
            <div class="col-sm-5"></div>
            <div class="col-sm-7">
                <button id="btnCreateChart" class="btn btn-primary">Create Chart</button>
            </div>
        </div>
    </div>
    <div class="col-md-9">
        <div id="chart" style="width:100%;height:700px;overflow:hidden;padding:10px">
            <div id="candlestick" style="height:55%"></div>
            <div id="volume" style="height:30%;margin-top:-1%"></div>
            <div id="filter" style="height:15%;margin-top:1%"></div>
        </div>
    </div>
</div>
@section scripts{
    <script type="text/javascript" src="https://www.gstatic.com/charts/loader.js"></script>

    <script>
        createStockChart();

        $('#btnCreateChart').click(function () {
            createStockChart();
        });

        function createStockChart() {
            google.charts.load('current', { 'packages': ['corechart', 'controls'] });
            google.charts.setOnLoadCallback(drawChart);
            var chart_div = document.getElementById('chart');
            var ticker = document.getElementById('ticker').value;
            var startDate = document.getElementById('startDate').value;
            var endDate = document.getElementById('endDate').value;

            var viewStartDate = (new Date(endDate));
            viewStartDate.setMonth(viewStartDate.getMonth() - 3);
            var viewEndDate = new Date(endDate);

            function drawChart() {
                var data = new google.visualization.DataTable();
                data.addColumn('datetime', 'Date');
                data.addColumn('number', 'Open');
                data.addColumn('number', 'High');
                data.addColumn('number', 'Low');
                data.addColumn('number', 'Close');
                data.addColumn('number', 'Volume');

                $.ajax({
                    url: '/api/apiStockData/' + ticker + '/' + startDate + '/' + endDate + '/daily',
                    method: 'GET',
                    dataType: 'json'
                }).done(function (d) {
                    d.forEach(function (di) {
                        data.addRow([{ v: new Date(di.date), f: di.date }, di.open,
                                       di.high, di.low, di.close, di.volume]);
                    });

                    var dashboard = new google.visualization.Dashboard(chart_div);
                    var control = new google.visualization.ControlWrapper({
                        controlType: 'ChartRangeFilter',
                        containerId: 'filter',
                        options: {
                            filterColumnIndex: 0,
                            ui: {
                                chartType: 'LineChart',
                                chartOptions: {
                                    chartArea: {
                                        height: '80%', width: '85%', left: 100,
                                        backgroundColor: { stroke: "gray", strokeWidth: 1 }
                                    },
                                    hAxis: { baselineColor: 'none' }
                                },
                                chartView: { columns: [0, 4] },
                            }
                        },
                        state: {
                            range: {
                                start: viewStartDate,
                                end: viewEndDate
                            }
                        }
                    });

                    var chart = new google.visualization.ChartWrapper({
                        chartType: 'CandlestickChart',
                        containerId: 'candlestick',
                        options: {
                            chartArea: { height: '80%', width: '85%', left: 100,
                                         backgroundColor: { stroke: "gray", strokeWidth: 1 } },
                            hAxis: { type: 'category', slantedText: false, maxTextLines: 1,
                                     maxAlternation: 1 },
                            legend: { position: 'none' },
                            candlestick: {
                                fallingColor: { strokeWidth: 0, fill: '#a52714' },
                                risingColor: { strokeWidth: 0, fill: '#0f9d58' }
                            },
                            title: 'Stock Price: ' + ticker,
                        },
                        view: { columns: [0, 3, 1, 4, 2] }
                    });

                    var volume = new google.visualization.ChartWrapper({
                        chartType: 'ColumnChart',
                        containerId: 'volume',
                        options: {
                            chartArea: { height: '80%', width: '85%', left: 100, top: 40, bottom: 30,
                                         backgroundColor: { stroke: "gray", strokeWidth: 1 } },
                            hAxis: { type: 'category', slantedText: false, maxTextLines: 1,
                                     maxAlternation: 1 },
                            legend: { position: 'none' },
                            title: "Volume: " + ticker
                        },
                        view: { columns: [0, 5] }
                    });

                    dashboard.bind(control, [chart, volume]);
                    dashboard.draw(data);

                }).fail(function () {
                    alert('Failed to create the chart. Please try it again.');
                });
            }
        }

    </script>
}
The code first loads the current version of corechart API using google.chart.load method and implements a function named drawChart. Pay special attention to how we use Ajax to access the stock data created on the server by the RESTful API controller, and how we add the stock data to the DataTable in a row-by-row manner.
Next, we use the Google Charts API to combine multiple charts into a dashboard and provide you the ChartRangeFilter control to manipulate what data they show. The dashboard receives a DataTable containing the data to visualize and take care of drawing and distributing the data to all the charts that are part of the dashboard. In our example, the dashboard includes three parts: a ChartRangeFilter control, a candlestick chart, and a volume chart.
Running this project and clicking the Stock Charts from the top main menu generate a default stock chart for SPY, as shown in Figure 2.

Figure 2: Default stock chart for SPY.
Now, you can enter any valid US stock ticker in the Ticker field and make whatever changes for the time period, and finally click the "Create Chart" button to create the stock chart.
For example, enter IBM in the ticker field, and enter 2010-01-01 and 2015-05-31 to the Start Date and End Date fields respectively. Now click the "Create Chart" button, which will create a stock chart for IBM, as shown in Figure 3.
Figure 3: Stock Chart for IBM.
You can see from Figure 2 and Figure 3 that the charts are divided into three parts: at the top is the candlestick chart for the stock price (open, high, low, and close); at the middle is the volume chart; and at the bottom is the range select control used to select a range to display within the chart. The range select control, consisting of a slider with two thumbs, displays a view of the entire dataset, which provides tools to zoom in and out on parts of the data as well as panning across the dataset.
Jack Xu has a PhD in theoretical physics. He has over 25-year programming experience in Basic, FORTRAN, C, C++, Matlab, C#, WPF, and R, specializing in numerical computation methods, algorithms, physical modeling, computer aided design tools, graphical user interfaces, 3D graphics, and database systems. In recent years, he works as a quant analyst and developer on Wall Street and is responsible for quantitative analysis, trading strategy development, and real-time trading system implementation. He has published 9 books on C#, .NET chart/graphics programming, numerical methods, and quantitative finance. Recently, he developed a new graphics creation and technical analysis platform called Gincker.com, which allows users to create advanced charts and graphics just by typing in a mathematical formula or loading a dataset without the need to write a single line of code or rely on any special software package.


 General
  News
News  Suggestion
  Question
  Bug
Bug  Answer
  Joke
Joke  Praise
  Rant
Rant  Admin
Admin 


