Introduction
Before the .Net Core was relased with it's Middleware architecture, the most conveniet way for logging errors in the web application was ELMAH or similar. But since .Net Core has different architecture, not module based, but middleware based, the ELMAH is not in action any more. This article introduces how to integrate a simple logger very similar to ELMAH that stores latest 200 errors in memory.
To see it in action, follow steps below:
- Download the source code, open project locally, make sure that you have .Net Core App 1.0 installed and latest updates for VS2015. Compile the project successfully.
- Run the web application and open http://localhost:28157/Home/EmulateError in browser, to simulate application exception in the controller action. Refresh the page several times.
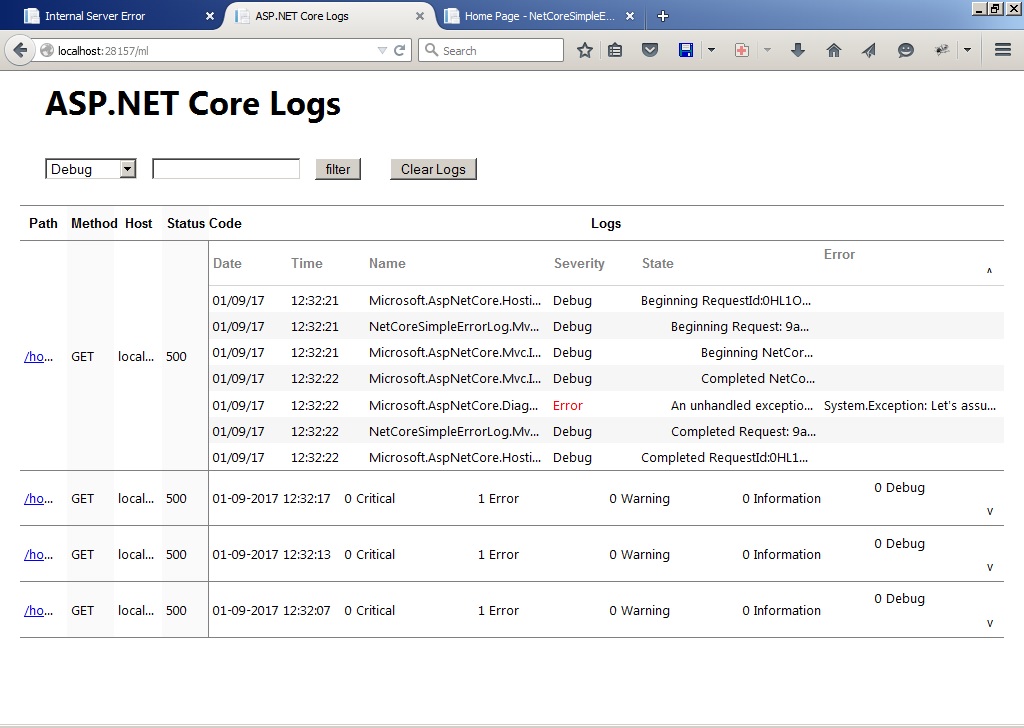
- Open MVC Logger error history page http://localhost:28157/ML to see the information about recent application exceptions. Navigate to the details page by clicking on the first left column link.
Background
The only proposed by Misrosoft error logging solution - is Application Insights, which is payeble Azure based service. It has a lot of different metrics, boards, is heavy with major goal to stabilize application and improve reliability. So most of the developers, who is doing web applications based on .Net platform need a simple, light weight, free application logger, to easily access error history with details. The following way you can create your own customizable .Net Core logger for Middleware architecture.
Using the code
The proposed solution is based on the Microsoft Elm https://github.com/aspnet/Diagnostics, but has significant modifications. Below is explanation of the code base.
The logger itself is a Middleware layer. That's why it needs to set proper configuration to get it involved in application execution flow. In the application Startup.cs file (located at the root), need to register logger Middleware service:
public void ConfigureServices(IServiceCollection services)
{
    services.AddMvcLogger(loggerOptions =>
    {
        loggerOptions.Filter = (loggerName, loglevel) => loglevel == LogLevel.Error;
    });

    ........
}
The next step is to configure the logger page and error capture in the execution pipeline:
public void Configure(IApplicationBuilder app, IHostingEnvironment env, ILoggerFactory loggerFactory)
{
    ........

    if (env.IsDevelopment())
    {
        app.UseMvcLoggerPage();
        app.UseMvcLoggerCapture();
        app.UseDeveloperExceptionPage();
        app.UseBrowserLink();
    }
    else
    {
        app.UseExceptionHandler("/Home/Error");
    }

    ........
}
Thats it. The configuration is done. Now you can access the logger screen on the same host with 'ML' path -> http(s)://...host.../ML . That Url can be simply changed to any other path in the CoreMvcLogger/MLCaptureMiddleware.cs ->
public class MVCLoggerOptions
{
    public PathString Path { get; set; } = new PathString("/Ml");

    ..........
}
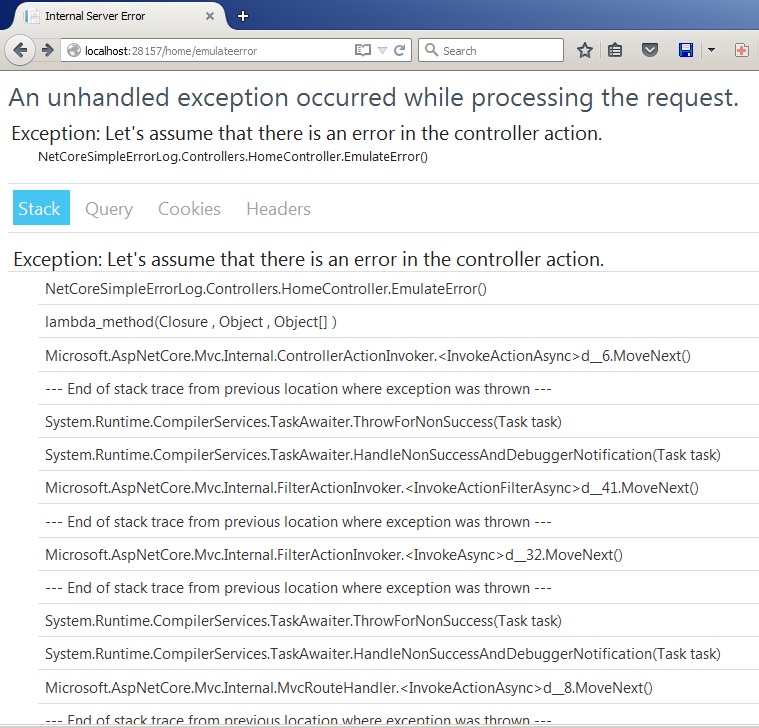
The default ASP.NET Core MVC error details page is NOT replaced by this error logging middleware, so in case of any error on the development environment you would still see the default error details pretty view:
The newly integrated MVC Logger error list screen:
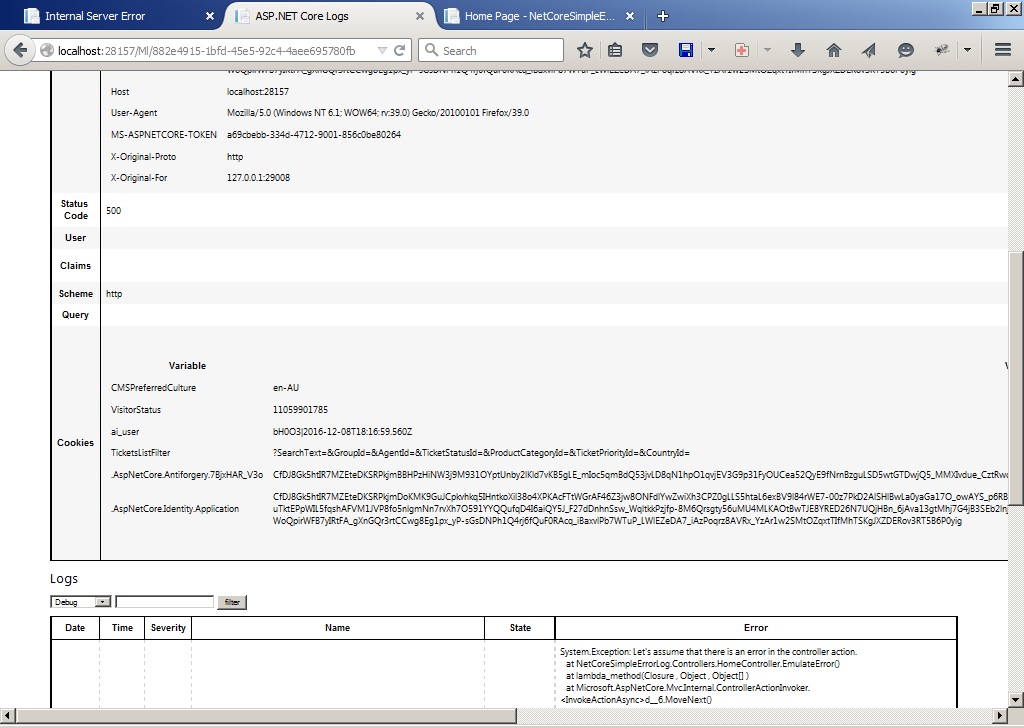
When clicking on the Url link in the first left column, all scope variables along with exception details are show:
The advantages of using own simple error logger are significant, let's count just some of them:
- it's free of charge, originaly was distributed by Microsoft for developers;
- MVC logger captures all application errors that happened for any user of the system, in all Middleware layers, stores the details and allows easily access for the issue investigation;
- detailed information about exception and all environment ( request ) variables can be accessed in two mouse clicks;
- the MVC logger errors list view is located on the same host with application, so accessing it is simple and fast.
- both screens are available: the detailed, default MVC Error report page and MVC logger historical error snapshot page.
- since the source code is available it can be easily modified per current needs, for example capturing application - specific information during request, filtering out errors that are not interested, etc.
Explaining Logger code
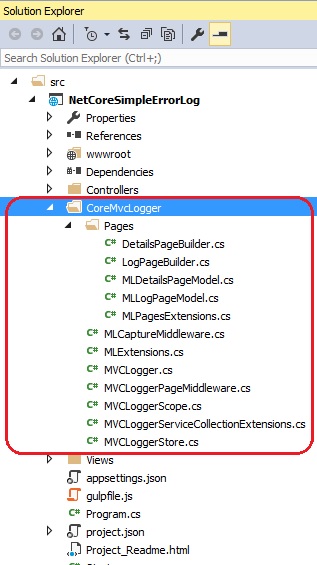
Originally, the sample .Net Core logger has been published by Microsoft on their GitHub Account https://github.com/aspnet/Diagnostics/tree/dev/src but there are multiple issues with that logger. It requires specific version of the .Net Core (currently there are three versions 'preview', 'release candidate', 'final'). There are issues with expception details rendering on the error screen, because there is razor parser engine parser / generator is in use. Error filtering by LogLevel Severity is not working, etc. All of these issues are fixed in the the stable MVC Logger, which is attached to the current article. Your own MVC Logger can be reworked as you wish, because it's not compiled into dll, but should be included into project.
MVC Logger service entities are added in the MVCLoggerServiceCollectionExtensions.cs file
public static IServiceCollection AddMl(this IServiceCollection services)
{
    if (services == null)
    {
        throw new ArgumentNullException(nameof(services));
    }

    services.AddOptions();
    services.TryAddSingleton<MVCLoggerStore>();
    services.TryAddSingleton<MVCLoggerProvider>();

    return services;
}
Registering middlewares for page render and error capture in done in the MLExtensions.cs file
public static IApplicationBuilder UseMvcLoggerCapture(this IApplicationBuilder app)
{
if (app == null)
{
throw new ArgumentNullException(nameof(app));
}
var factory = app.ApplicationServices.GetRequiredService<ILoggerFactory>();
var provider = app.ApplicationServices.GetRequiredService<MVCLoggerProvider>();
factory.AddProvider(provider);
return app.UseMiddleware<MLCaptureMiddleware>();
}
public static IApplicationBuilder UseMvcLoggerPage(this IApplicationBuilder app)
{
if (app == null)
{
throw new ArgumentNullException(nameof(app));
}
return app.UseMiddleware<MVCLoggerPageMiddleware>();
}
Every http request is represented by scope. Everything, which is happening during that http request belongs to particular scope. That's why when an exception is captured it is saved inside root scope, instead of just pushing to common list. The code for starting a new scope is in the MVCLogger.cs file
public IDisposable BeginScope<TState>(TState state)
The actual code for error or trace info capturing is also in the MVCLogger.cs file
public void Log<TState>(LogLevel logLevel, EventId eventId, TState state, Exception exception,
                          Func<TState, Exception, string> formatter)
There is a code in the MVCLoggerPageMiddleware.cs file for filtering out all scopes, when rendering list page, that don't have any logged information that feets the filter criteria, this code should be customized per your needs:
private bool HasAnyRelevantMessage(MVCLoggerScopeNode node, MVCLoggerOptions options)
{
    var hasAnyRelevantMessage = node.Messages.Count > 0 && node.Messages.Any(ms => options.Filter("any", ms.Severity));

    foreach (var nd in node.Children)
    {
        hasAnyRelevantMessage = hasAnyRelevantMessage | HasAnyRelevantMessage(nd, options);
    }

    return hasAnyRelevantMessage;
}
The code for rendering Error list html page and Error details html page is located in the MVCLoggerPageMiddleware.cs class.
private void RenderMainLogPage(MVCLoggerViewOptions options, HttpContext context)

private void RenderDetailsPage(MVCLoggerViewOptions options, HttpContext context)
n case you need to change amount of error reports, stored in memory, you can do that in the MVCLoggerStore.cs file:
public class MVCLoggerStore
{
    private const int Capacity = 200;

    ........
}
History
Released by Sem on Monday, 9th of January 2017
Individual software developer, good experience with PHP, Java, .Net, NodeJs, Ruby on Rails, JavaScript, LESS, CSS3, HTML5, jQuery, CoffeeScript, ExtJS, Backbone, AngularJS, AJAX, Amazon s3 services, Azure. Programming is not just my work, but more like a hobby. I'm glad to learn new pattern and technologies, making research and study new things. I work remotely for couple of years. More than nine years I'm writing commercial projects.


 General
  News
News  Suggestion
  Question
  Bug
Bug  Answer
  Joke
Joke  Praise
  Rant
Rant  Admin
Admin 


