Introduction
Extend the functionality of the existing systems and give a fast and easy to use base setup and helpers. This will help create Timers and Logging that are easy and quick to use so you can focus more on your tests and less on your timing data. I will also give some examples of usage and Mix Scenarios.
Precursor
Please read this Tip first, it describes proper setup for the TestContext property and a quick How-To on the TestContext Timer.
A Load Test, using the Visual Studio Load Test system, is a wrapper around Unit Tests or a Web Performance Test. "Regular" Performance Tests can be Unit Tests or Load Tests if you setup the Load Test Properly.
Prerequisites
You must have Visual Studio Ultimate or Visual Studio Enterprise to be able to run load tests.
For Hardware Requirements for Test Agents and Controllers, see the Microsoft's Library Page.
Overview
The structure used below will be setup in a way that IOC (Inversion Of Control) and DI (Dependency Injection) can be used for the logging system. You can follow the structure below or setup everything in one project, or however you are comfortable.
Projects and Classes
Format is "Folder > ClassName.ext : DerivedFrom (Type)"
MainProject
Core > TestBase.csUnitTests > TestCase1.cs : TestBaseLoadTests > LoadTest1.loadtest
LoggerCore
- Interfaces > ILog.cs (Interface)
CustomLogger
- Logging.cs
- Helpers > CustomTimer.cs
ConsoleLogger
Getting Started
If you are starting a new project, go ahead and setup the Solution and Projects you are going to use, otherwise you can just follow along and add these parts to your existing setup.
This system will not cover IOC or DI as that is outside of the scope, but the setup shown will let you have everything in place to easily set that up later. In a future tutorial, I will cover actually employing IOC and DI with this project.
Logging System
We want to make the logger interchangeable, so we will need an interface, we will just keep this very simple. This will also allow IOC and DI to be added later.
public interface ILog
{
    void WriteLogMessage(string message);
}
Next, we need the Logging.cs class. Again, this is going to be very simple and basic.
public class ConsoleLogger : ILog
{
    public void WriteLogMessage(string message)
    {
        Console.WriteLine(message);
    }
}
At this point, we could just use the logger directly, but we want it to be easily interchangeable. This where the CustomLogger project comes into play, we will use it to handle changing the logger that is being used and for delegating the actual process of writing the log message.
This class is commented so you can defer to the comments for the breakdown.
The main point is to have a single point of responsibility for logging, no matter which logger you are using. Also, when running Performance Tests or Load Tests, we do not want to include the time it takes to write to our logger in the process. For instance, a performance test that takes 10 milliseconds to complete, and logging to the database takes 200 milliseconds, then most of your time spent is actually in logging. Here, I am handling the issue by storing the logs in memory and outputting the results at the end of the test run. A much better approach would be to setup an asynchronous logger and just write to the logging system as needed.
public class Logging
{
public static ILog Logger { get; set; }
private static List<string> _queuedLogMessages = new List<string>();
public static void SetLogger()
{
Logger = new ConsoleLogger.ConsoleLogger();
}
public static void WriteLogMessage(string message)
{
if (Logger == null)
{
throw new NotImplementedException("The Logger has not been setup,
use SetLogger() to setup the logger!");
}
Logger.WriteLogMessage(message);
}
public static void QueueLogMessage(string message)
{
_queuedLogMessages.Add(message);
}
public static void WriteQueuedLogMessages()
{
foreach (string message in _queuedLogMessages)
{
WriteLogMessage(message);
}
}
}
At this point, we have a fully interchangeable, reusable and independent logging system that can be used for anything you like. Implementation and usage will be shown as we continue. There are some drawbacks, storing the logs in memory can get expensive if you are running a lot of tests over a long time. If you are trying to see the effects of the tests themselves on memory use, you will get your logging data mixed in with your program memory usage.
Timer Wrapper
Overview
You can use the standard Timer directly for BeginTimer and EndTimer, but it has a few issues.
- You have to use the
string Name to both start and stop, variables can handle this but you may end up with a lot of variables storing strings. There is nothing wrong with this approach, I just feel like it can be made easier. - If you try to call
BeginTimer when you are not running a Load Test, you can get a "Method Not Supported" error. An interesting side note, I was able to run the tests as unit tests with no error until one day for no apparent reason, I started getting the error.
There is some extended functionality we wanted to add.
- In my current environment, I wanted to run the tests as Performance Tests and Load Tests automatically with our builds and have the system analyze the results compared to prior runs and thresholds, to do this, we want to log the times to a database. That is where the interchangeable logger comes in.
- We wanted flexibility to change the logger depending on our needs at the time. For instance, we may want to run the tests and view the log info in the output of the test or have the results sent to a database as mentioned before. Also, you cannot see the console output of tests run as Load Tests so you may want to have a
NoLoging logger.
So in the end, we really need three things, a timer for Load Tests, a Timer for Performance Tests, and we want the system to automatically log our times and duration.
Code for the Wrapper
public class CustomTimer
{
private Stopwatch _timer;
private string _actionName;
private TestContext _testContext;
public CustomTimer(TestContext testContext, string actionName)
{
_testContext = testContext;
_actionName = actionName;
_timer = new Stopwatch();
CustomLogger.Logging.QueueLogMessage($"Started Action:
'{actionName}' at {DateTime.Now:MM-dd-yyyy hh:mm:ss t z}");
if (testContext == null)
{
CustomLogger.Logging.QueueLogMessage("TestContext is null");
}
else
{
if (_testContext.Properties.Contains("$LoadTestUserContext"))
{
_testContext?.BeginTimer(_actionName);
}
}
_timer.Start();
}
public long End()
{
_timer.Stop();
CustomLogger.Logging.QueueLogMessage($"Action {_actionName}
completed in {_timer.ElapsedMilliseconds} Milliseconds");
if (_testContext == null)
{
CustomLogger.Logging.QueueLogMessage("TestContext is null");
}
else
{
if (_testContext.Properties.Contains("$LoadTestUserContext"))
{
_testContext?.EndTimer(_actionName);
}
}
return _timer.ElapsedMilliseconds;
}
}
Test Base
Now, we will move onto the TestBase.cs class. This class will do some of the repetitive work for us and we will derive all of our Unit Tests from this class.
First, we are going to need access to the TestContext. As described in the tip mentioned before, the placement and setup of this is crucial. Under some circumstances, you can use a static variable and you will never know the difference, if you are just using the TestContext as a read only object. But in load tests, the TestContext needs to be unique for each "Test Run Instance" to make the timers work properly.
I normally name the methods with Test Attributes in a way unique to the current class as sometimes the system has issues with overriding in derived classes. For example, if your Test Base has a method TestInitialize() and the Derived Test Case has a method TestInitialize(), the system will only call one of them and not the other. But if you name them differently, the system will call both. This is not 100% true, there are only some attributes that I have seen have this issue, but I just made it my standard convention for good measure. This does not apply to AssemblyInitialize or AssemblyCleanup as you can only have one of each in your entire project. A pretty good article covering this can be found HERE.
[TestClass]
public class TestBase
{
private TestContext m_testContext;
public TestContext TestContext
{
get { return m_testContext; }
set { m_testContext = value; }
}
[AssemblyInitialize]
public static void AssemblyInitialize(TestContext testContext)
{
CustomLogger.Logging.SetLogger();
CustomLogger.Logging.QueueLogMessage
($"{MethodBase.GetCurrentMethod().Name} started at {DateTime.Now:G}");
}
public static void TestBaseClassInitialize(TestContext testContext)
{
}
[TestInitialize]
public void TestBaseTestInitialize()
{
}
[TestCleanup]
public void TestBaseTestCleanup()
{
CustomLogger.Logging.QueueLogMessage
($"{MethodBase.GetCurrentMethod().Name} started at {DateTime.Now:G}");
}
public static void TestBaseClassCleanup()
{
CustomLogger.Logging.QueueLogMessage
($"{MethodBase.GetCurrentMethod().Name} started at {DateTime.Now:G}");
CustomLogger.Logging.WriteQueuedLogMessages();
}
[AssemblyCleanup]
public static void AssemblyCleanup()
{
}
}
Order of Events
Here is the breakdown of the order of execution of items in the TestBase and the derived UnitTest1. (TestBase is blue and UnitTest1 is Italicized for readability).
TestBase.AssemblyInitialize() calledUnitTest1.ClassInitialize() called > Calls > TestBase.TestBaseClassInitialize()TestBase.TestContext gets set by the Test Execution EngineTestBase.TestInitialize() calledUnitTest1.TestInitialize() calledUnitTest1.TestMethod1() Code runsUnitTest1.TestCleanup() calledTestBase.TestCleanup() calledUnitTest1.ClassCleanup() called > Calls > TestBase.TestBaseClassCleanup()TestBase.AssemblyCleanup() called
First Unit Test
Now, we can put all of this together and make a Unit Test. You have already seen methods that can be in the UnitTest1 class and the order they are called in. Only two of those actually need to do anything at this time, the ClassCleanup and ClassInitialize, they need to call the base class methods with similar names.
Here is the fully setup TestClass1:
[TestClass]
public class UnitTest1 : TestBase
{
[ClassInitialize]
public static void ClassInitialize(TestContext testContext)
{
TestBaseClassInitialize(testContext);
}
[TestInitialize]
public void TestInitialize()
{
}
[TestCleanup]
public void TestCleanup()
{
}
[ClassCleanup]
public static void ClassCleanup()
{
TestBaseClassCleanup();
}
[TestMethod]
public void TestMethod1()
{
}
}
Now at this point, you should be able to run your test and see the logging that is in place write to the console by clicking output in the Test Explorer window.
The following code is how to setup and use the timer. Add this to your TestMethod1 method in the UnitTest1 class:
CustomTimer actionTimer = new CustomTimer(TestContext, "DoWork 1");
  Thread.Sleep(100);
  actionTimer.End();

  actionTimer = new CustomTimer(TestContext, "DoWork 2");
  Thread.Sleep(100);
  actionTimer.End();
From here, you should be ready to start making unit tests that use the timer that logs messages to the console. Next, we will setup a Load Test to run the Unit Test and break down what does what and when.
Adding a Load Test
Right click where you want to put the Load Test > Click Add > Click Load Test. The Load Test Wizard will appear:
- On the first page, click On Premise Load Test
- Click Next
- Check Load test duration if it is not already checked, and set the duration to 1 minute
- Click Next
- On the Scenario tab, check Use normal distribution, and leave Think time between test iterations at
0 - Click Next
- Select Constant Load and set the User Count to
5 - Click Next
- Select Based on the total number of tests
- Click Next
- Click Add > Click the name of your
UnitTest (TestMethod1) > Click the Right Arrow > Click Ok - Click Finish, we will skip the other pages as we do not need to do anything there.
The test should open and we should be able to run it now. Click Run Load Test to start the "Load Test Run".
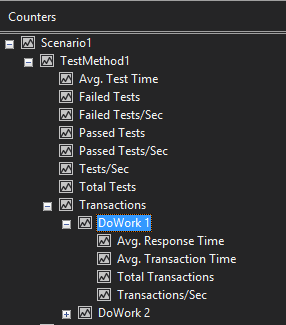
The statistics on screen are great, but you will not see your timers yet. If you expand Scenario1 > TestMethod1 > Transactions, you will see all of your timers.
Here is an easy way to view your timers in the graph. Click one of the graphs > Right click Transactions> Click Add Graph > Right click one of the timers (IE DoWork1) > Click Show On Graph.
Missing Timers
If you put timers in ClassInitialize, they will not show up in Transactions. If you refer back to the order of method calls, you will see that the TestContext is set after ClassInitialize is called. I am not fully clear on the details of what is happening in the background, but it seems the TestContext passed to the static ClassInitialize is separate from the TestContext set by the "Test Execution Engine" and does not report the timer data.
Points of Interest
- Store login sessions to reuse, unless you expect every user to login every time a test is run.
- Avoid load testing your logging system, by logging async or write your logs outside of the test run.
- Timers only work in
TestInitialize, the Test Method and in TestCleanup. - Geo locations error is received when you run tests On Premise. You can manually edit the .loadtest file to remove the lines, more information on that HERE.
What's Next
From here, you have a working load test system. Below, I will expand on what some of the data and metrics mean and give some examples of usages.
Data Overload
There is so much data to look at, you probably will not even know where to start. The values are pretty straight forward in meaning, so I will only put the basic equations they are using and only go over the primary ones. As a side note, Sampling Rate below is setup in the "Load Test Wizard" in Run Settings section, the default value is 15 seconds.
- Under Key Indicators
- UserLoad: Current users Count
- Tests/Sec: Test Completed in Sampling Rate / Sampling Rate
- Avg. Test Time: Total time of all tests / Number of Tests
- Error/Sec: Number of errors in Sampling Rate / Sampling Rate
- Threshold Violations/Sec: Threshold Violations in Sampling Rate / Sampling Rate
- CustomTimers
- Avg. Response Time: Transaction Time minus Think Time
- Avg. Transaction Time: Transaction Time plus Think Time
- Total Transactions: Number of times that transaction happened
- Transactions/Sec: Number of Transactions per second
Avg. Response Time and Avg. Transaction Time will be the same on CustomTimers as Think Time does not apply, they are in the same Transaction.
There is much much more to go through. You will have to go through them and determine which values are useful to you in your situation.
Test Results Tabs
After the test run is complete, the screen should change from the Graphs to the Summary Tab.
- Summary Tab: Overall values like total number of tests run and the average test time. You will also see a breakdown of all of your timers and average times for those.
- Graphs Tab: see the graphs and let you sort and filter your data.
- Tables Tab: the breakdown of the different tests in your test mix.
- Details Tab: shows you "Virtual User Activity", here you can see when and how often the Virtual Users completed
Transactions.
Results on Other Computers
To view Test Run Results on another computer, you have to export the Test Run Results. Then on the other computer, Import the Test Run Results. Import and Export is done in the Test Results window. The computer you imported the results to must have access to the original computers SQL instance as it has to connect to the database server on that computer to load the data from.
Virtual User Load Vs Actual User Load
We need to separate the difference between Virtual Users and Actual Users of a system. For Scenario 1, let's say we have a test that takes .1 seconds to complete, that means 1 user will be running ~10 tests per second. That means 100 Virtual Users will be running 1000 tests per second. Now let's assume Actual Users will only be doing that action once every 10 seconds each. That means our 100 Virtual Users are simulating the load of 10,000 Actual Users.
Another approach, Scenario 2, would be to have your Virtual Users mimic an Actual Users. So each Virtual User would have a 9.9 second Think Time. This would mean they would only be able to run the test once every 10 seconds. In this scenario, you would need 10,000 Virtual Users to simulate the same load as above.
There is a difference in what happens in those two approaches. Let's say in Scenario 1, you start with 100 Virtual Users. Now each of those will start and at the same time, they do the same work. That means your task is called 100 times at the same time.
Now if you use Scenario 2, you have 10,000 Virtual Users that all start the same task at the same time. Meaning in one setup, you have 100 calls to the same task, and in the other you have 10,000. If say you are doing a search and hitting a database for the results, that means the difference between 100 calls at the same time and 10,000 calls at the same time.
Obviously, the database will process these as fast as possible, but 10,000 calls may be too much and the database may take a while to return the 10,000th data set. Scenario 1 does not have a wait time so it will make 100 more calls as soon as the first call completes for each Virtual User. Scenario 2 may not even be done processing the 10,000 original calls, so some of the Virtual Users may have completed the test and waited for 10 seconds and may be running the test again but some of the Virtual Users may still be waiting for the database to return the data needed before they can start waiting for the next iteration.
Basically, it is the difference between 100 calls per iteration with short iterations, or 10,000 calls per iteration with longer waits in between iterations. The results can be dramatically different.
Using Step Load
To avoid having all calls done at the same time at the start, you can use the Step Load setting from the Load Test Wizard > Scenario > Load Pattern tab. For Scenario 1, you would set start user count to 10, then add 5 users every second and have a maximum user count of 100. This makes it so only 5 users will be running the task at the same time. In this setup it would take 45 seconds to get to 100 users. The settings for this would be:
- Start user count: 10
- Step duration: 1
- Step user count: 5
- Maximum user count: 100
This will change your result data though. Your total number of tests will decrease as you started with a lower number of testers and ramped them up over time. You will also see a lower average tests per second, as the load was very low at the starting point.
Scenario 2 would exaggerate the effect a lot more, as even if you start with 100 users and added 100 users every second, it would still take 90 seconds to get all of your users running. You would still have 100 simultaneous users running the task.
Assuming the tests finish instantly, and taking the fact there are 10,000 users running the task every 10 seconds each, the actual average load would be the task is called 166 times per second. Adding 100 at a time would space out the task run sets. You would end up with 100 users or 0 users any given second until you reached 1 minute, at that point, you would add 100 users every second.
On the 61st second, user count in that second would increase from 100 users to 200 users and progress, but at some point, you will end up with an uneven load as some seconds will have 200 users and some will remain at 100, since the users will not be spread evenly across the separate seconds. So the sets that are running 200 users are actually hitting more load than the average of 166 per second. All of that is just theoretical as your tests would have to complete instantly and alight with seconds exactly.
A Different Approach
Another way of setting up the test is to use a Test Mix Model of Based on user pace (in the Load Test Wizard). This means the tests will run at a count of the Number of Tests, Per User, Per hour. In our scenario above, let's say each Actual User only runs the task once every 10 seconds, that means they run that task 6 times per minute, and 360 times per hour. So in the Test Mix, you can set the test to have Tests Per User Per Hour to 360, and then scale out the number of Virtual Users to simulate your load.
Graphical Analysis
Now to look at the graphs created by the test run and break down some of what is going on.

Looking at the Key Indicators graph above, the red line shows User Load (Number of Users). The User Load Increases because the test scenario adds 1 user every 5 seconds. This also shows the Tests Per Second increases, since the number of users running the tests increases. Avg. Test Time does not change as we are able to run the tests at a steady pace.
If you have a bottleneck in your software, you will see User Load Increase, but Tests/Sec (Tests Per Second) could stay at a constant amount. For this scenario, imagine a database can only supply data for 5 tests per second. At this point, no matter how many users there are, once you reach 5 tests per second, the Tests/Sec value will stay steady at 5. Avg. Test Time will Increase as the other tests have to wait for the other tests to complete.
Avg. Test Time in the picture above for Test Response Time, Avg. Test Time stays steady because each individual test takes the same amount of time. If increased load slows the software down,, you will see an increase in response time as you get higher loads.
Here, we can look at the details of our Custom Timers. Total Transactions increase here because the tests never get any slower as we increase load. This value should be directly proportionate to the number of users if you do not have any bottlenecks or slowdowns. Avg. Transaction Time and Avg. Response Time should stay steady.
Running Tests
You can run the tests using the Visual Studio UI, but it does use memory and CPU. An alternative is to run tests using MSTest. Using this setup after the test run is complete, you can open the resulting TRX file and view the results in Visual Studio. For more information, see the Microsoft Library Page.
Post-face
From here you will have to determine the Test Mix that is right for you in your setup. This can be a difficult task in itself, but hopefully this was helpful information to get you started and on the right track.
Of course, there are improvements that can be made to the code examples set here, but I wanted to keep the technical complexity of the article somewhat low. Setting the system to use IOC and DI did add extra complexity to the system from what it could have been, but I think it is the most beneficial approach. In the future, I will make a separate article/tip to add IOC and DI to this project, as well as an asynchronous logger.
History
- 28th December, 2016: Added "Graphical Analysis" and "Prerequisites" sections
I am currently an Automation Developer working on Coded UI Frameworks using Selenium, Load Testing Frameworks and Dynamic Data Frameworks for the prior mentioned testing systems. I maintain all of the software and hardware for our build, release and test systems, mostly using TFS, powershell and Hyper-V as well as building and maintaining Automated test systems.
Skills
SQL, Software Development, Microsoft SQL Server, Agile Methodologies
C#, JavaScript, HTML, C++, Markdown, XAML, XML
Quality Testing, Coded UI Testing, Selenium Testing, Load Testing
ALM, Team Foundation Server/VSO, Build Administration
Databases SQL/Oracle, Software and Hardware Installation/Maintenance
Troubleshooting, Project Management,
Solid State Electronics, Pulse Width Modulation, Metal Casting, Carbon Fiber Casting, Powder Coating.


 General
  News
News  Suggestion
  Question
  Bug
Bug  Answer
  Joke
Joke  Praise
  Rant
Rant  Admin
Admin 


