Introduction
This article introduces simple procedure for generating an organization chart with Silverlight technology.
Background
The goal of the project was to create Silverlight control, presenting company employees in organization chart. Control is dedicated to any kind of company - small and midle-size. Due to the fact that chart control is “settle” on SharePoint server , the chart control has been wrapped into parameterizable ASP.NET web part.
This article describes another approach for drawing organization structure. There are many sharewares or freewares drawing organization structure, but they usually use Canvas as the main control . For ASP.NET applications this is the only way to successfully draw the structure. My approach is easier and totally independent from any third party drawing libraries. First of all , chart control is created with StackPanel control without Canvas. Unlike Canvas control , StackPanel automatically aligns child items horizontally or vertically. Secondly auto scaling process is resolved with Silverlight native control ViewBox.
A personal note
This is my first article and I realize that some algorithms and code quality might be better, especially redrawing procedure, which is called every time, after MainStackPanel resolution is changed.
System requirements
- SharePoint operating system: Windows 7 , Windows 2008
- SharePoint platform: MS SharePoint Foundation 2010
- Browser: latest IE, Firefox
- Browser adds: Silverlight 5.0 runtime
Tools and components
Using the code
Parts of the solution
- MB.OrganizationChartWebPart.Web – ASP.NET web app hosting MB.OrgChartWebPart application.
- MB.OrgChartConnector – SharePoint list connector project.
- MB.OrgChartControl – Silverlight organization chart control (main project).
- MB.SilverlightOrgChartApp –Silverlight application hosting MB.OrgChartControl control (for test purpose).
- MB.OrgChartWebPart – Silverlight application project hosting MB.SilverlightOrgChartApp application.
Class diagram
Classes relationships in UML notation

Project details
This chapter does not describe any algorithms details, for example tree layout drawing algorithm.
Chart elements
As I mentioned earlier, my solution is based on standard Silverlight controls such as: StackPanels, Grids, Labels, TextBlocks, so some kind of my controls acts as their extensions.
ViewBox – container responsible for scaling chart. Auto scaling occurs in case of changing resolution of the MainStackPanel. Scaling option only works for some kind of stretch types, provided in Stretch parameter.MainStackPanel – Main StackPanel container. It’s a parent for LevelStackPanels elements. Items are arranged in Horizontal position.LevelStackPanel –This type of object is drawing on each level of the chart. It’s a container for GroupStackPanel elements. Items are arranged in Horizontal position.GroupStackPanel – StackPanel container. Items are arranged in Horizontal position.ChartBox – Custom control holds employee details and represents exactly one position from the SharePoint list with 0 value in UnitType field. It displays data in two modes: Team or Organization.
Data tree structure building
At the beginning building process reads one by one each item from SharePoint list and creates structured tree object. Tree items are organized in parent – child relation via reference to its parent in ParentEID (except for root element) field. For more details just analyze code and see Drawing2DTreeBuilde class (MB.OrgChartControl project).
Displaying chart elements
According to the presentation mode (“Group by” parameter), tree structure items are displayed with following rules:
For Team mode
This mode is intended to display organization chart for small company or team.
Display rules:
- For items with UnitType = 0 display ChartBox
- Any other items with UnitType <> 0 are ignored
- ChartBox display all fields of SharePoint list item.
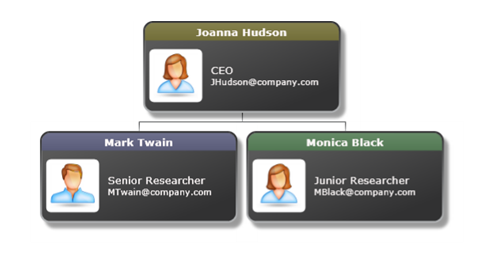
- Name and LastName values are displayed on ChartBox bar.
ChartBox control displays all list item data such us: Name, LastName, Email etc. See below for example:
For Organization mode: This mode is intended to display organization chart for middle-size company. Employees are grouped into divisions.
Display rules:
- For items with UnitType = 0 display
ChartBox control and Division field value on ChartBox bar. - Any other items with UnitType <> 0 assign to appropriate ChartBox
- Only Name and LastName of employee data are presented
ChartBox control displays grouped data by Division key. See below for example:
While displaying ChartBoxes on the screen, process automatically tries to properly arrange ChartBoxes. If created ChartBox has been displayed out of the screen range, the main container (MainStackPanel) receives an event object containing details of range exceeding. After painting has been finished and some chart scaling type (Fill, Uniform, UniformToFill) was chosen, process changes the resolution of the main container and repaints the chart (As you must have noticed quality and performers need some improvements but this will be embraced in next version) . For more details just analyze code and see Drawing2DVTree class (MB.OrgChartControl project).
Chart layout
The following screen presents chart layout and its StackPanels arrangement.
This member has not yet provided a Biography. Assume it's interesting and varied, and probably something to do with programming.


 General
  News
News  Suggestion
  Question
  Bug
Bug  Answer
  Joke
Joke  Praise
  Rant
Rant  Admin
Admin 


