Introduction
To visualize complex functions of a single complex variable,
we would need a four-dimensional space!
However, by encoding the values in the complex plane in colors,
we are able to visualize these functions in two dimensions.
This method is called Domain Coloring.
In this article, we provide a brief introduction to domain coloring
method.Then we explain how to implement it on GPU alongside some details
like parsing function's formula and navigation through the complex plane.
Besides the utility of this program in visualizing complex functions,
it provides a simple, yet instructive, example of using shaders.
Actually, this program was my first encounter with shaders,
but the results were so interesting, at least to me,
that I thought it worth sharing.
Before we start, let's just list the program features
so we know where we are heading to. The program should allow the following:
- Specifying function's formula using common mathematical expressions.
- Specifying several functions and switching between them.
- Zooming & panning through the complex plane.
- Switching between different color maps
Domain Coloring
For visualizing the function
 :
:
- Cover the range complex plane with some color map or scheme.
i.e give each point a color.
- For each point of the domain complex plane
,
compute
and then color
with the color of .
Illustrating Example
As a simple example, let us assume we want to
visualize the square function at
only four points .
We give each of these points in Range plane a
unique color. Then we compute the function values at these points
and color them according to the result: (green)
and (yellow).
The image to the right is called color map and the one to
the left is plot of .
For a through account of the method and interpreting the resulted plots,
check this very good article:
Visualizing complex analytic functions using domain coloring
Implementing on the GPU
The coloring of the domain complex plane is embarrassingly parallel as each point of the plane is processed independently.
To utilize the GPU in this problem, we map complex points to screen pixels and color them with a fragment shader.
The procedure outline is as following:
- Make a rectangle covering the whole screen using the graphics API.
The rectangle's fragments will be created by the fixed functionality of the graphics pipeline.
These fragments are the final pixels of the screen, because there is only one primitive and it is not clipped.
- Fragment shader is executed for each fragment. Inside fragment shader:
- Transform the fragment screen coordinates to a complex point
using a transformation matrix passed from main program.
-
Compute the function at that point
.
- Determine the fragment color according to the color map at
the resulting point .
Following these steps, fragment shader's main function would looks like this in GLSL:
out vec4 gl_FragColor;

uniform mat3 windowToComplex;
vec2 f(vec2 z);
vec4 complexToColor(vec2 w);

void main()
{

    vec2 z = vec2(windowToComplex * vec3(gl_FragCoord.x, gl_FragCoord.y, 1.0));

    vec2 w = f(z);

    gl_FragColor = complexToColor(w);
}
Some comments on the code:
vec2 data type is used to represent complex numbers.windowToComplex is a 3x3 matrix transforming the coordinates of fragment (pixel) to complex plane.
It is passed from the application to the shader as a uniform and changes when the user navigates through the complex plane.vec2 f(vec2 z) is the complex function we are visualizing.
The implementation of this function is not fixed and it will be constructed on the fly using the user input.vec4 complexToColor(vec2 w) returns the color associated with complex number according to the color map.
The following three subsections deal with
windowToComplex,
f and
complexToColor respectively.
Navigation Through the Complex Plane
Let us assume that the window has width w and height h
and that we want to see the area of the complex plane centered at
x0+iy0 with side as its minimum dimension
(the other dimension will be determined by the aspect ratio of the window),
then what is the transformation matrix windowToComplex between the window and the area of interest?
As you can see from the image above, the transformation can be carried out in three steps:
- Centering the window at 0,0 i.e. translation by
-w/2, -h/2. -
Scaling the window such that its smaller dimension equals
side i.e.
scaling by side/w if aspect ratio is smaller than one or
scaling by side/h if aspect ratio is greater than one.
- Matching window center with area center i.e. translation by
x0, y0.
So the final transformation matrix is just the multiplication of matrices corresponding to each step
(of course, expressed in homogeneous coordinates to allow for translations). After building the matrix, we send it to the shader as a uniform variable.
void updateView()
{
float ratio = w / h;
if (ratio < 1)
scale = side / w;
else
scale = side / h;
m[0] = scale;
m[1] = 0;
m[2] = scale * (-w / 2) + x0;
m[3] = 0;
m[4] = scale;
m[5] = scale * (-h / 2) + y0;
m[6] = 0;
m[7] = 0;
m[8] = 1;
glUniformMatrix3fv(loc, GL_TRUE, 1, m);
}
Obviously panning is simply done by manipulating x0 and y0 and zooming is done by manipulating side.
Evaluating Complex Function and Parsing its Formula
First of all, since GLSL does not support complex number, we implement
common operation on complex numbers:
float cAbs(vec2 z)
{
    return sqrt(z.x * z.x + z.y * z.y);
}

float cArg(vec2 z)
{
    return atan(z.y, z.x);
}

vec2 cMul(vec2 z1, vec2 z2)
{
    return vec2(z1.x * z2.x - z1.y * z2.y, z1.x * z2.y + z1.y * z2.x);
}

vec2 cDiv(vec2 z1, vec2 z2)
{
    if (z2.y == 0)
    {
        return vec2(z1.x / z2.x, z1.y / z2.x);
    }
    if (z2.x == 0)
    {
        return vec2(z1.y / z2.y, -(z1.x / z2.y));
    }

    float r = z2.x * z2.x + z2.y * z2.y;
    return vec2((z1.x * z2.x + z1.y * z2.y) / r,
            (z1.y * z2.x - z1.x * z2.y) / r);
}

vec2 cPow(vec2 z, int k)
{
    vec2 res = vec2(1.0, 0);
    if (k >= 0)
    {
        for (; k > 0; k--)
            res = cMul(res, z);
    }
    else
    {
        for (; k < 0; k++)
            res = cDiv(res, z);
    }
    return res;
}

vec2 cSin(vec2 z)
{
    return vec2(sin(z.x) * cosh(z.y), cos(z.x) * sinh(z.y));
}

vec2 cCos(vec2 z)
{
    return vec2(cos(z.x) * cosh(z.y), sin(z.x) * sinh(z.y));
}

vec2 cTan(vec2 z)
{
    float cx = cos(z.x);
    float shy = sinh(z.y);
    float temp = cx * cx + shy * shy;
    return vec2((sin(z.x) * cx) / temp, (shy * cosh(z.y)) / temp);
}

vec2 cExp(vec2 z)
{
    return exp(z.x) * vec2(cos(z.y), sin(z.y));
}

vec2 cLog(vec2 z)
{
    return vec2(log(cAbs(z)), cArg(z));
}
As we stated in the introduction, we would like to specify the complex function
in common mathematical expressions. Something like "(z-2)^2*(z+1-2i)*(z+2+2i)/z^3+exp(sin(z))"
should be executed in the shader as
"cDiv(cMul(cMul(cPow((z - vec2(2.0, 0.0)), 2), (z + vec2(1.0, 0.0) - vec2(0.0,2.0))), (z + vec2(2.0, 0.0) + vec2(0.0,2.0))), cPow(z, 3))+cExp(cSin(z))".
Now since shaders are compiled during runtime, we do not need an intermediate representation of the functions and our task is simplified into
translating the input string into the corresponding GLSL code and compiling it as the implementation of the function vec2 f(vec2 z).
For performing the translation, we use the lex & yacc tools .
The grammar rules and actions used for translation are found in files paraser.l and parser.y.
This grammar allows the user to specify the complex functions this way:
- Number are specified using decimal notation only.
- Letters 'z' and 'Z' are used for the complex variable.
- Letter 'i' can be prepended to any number to make it imaginary. e.g. 5i, -3.5i, i, 0.04i.
- Operators '+' '-' '/' '*' have the same meaning, associativity, and precedence as in the c/c++ language.
- Operator '^' is the raising power operator, left associative and has the highest precedence.
Only integer(positive or negative) powers are allowed.
- A number can be prepended to the complex variable for multiplication e.g. -4.5z.
Hint: This is faster than -4.5*z because the former case is translated to
-4.5*z,
while in the latter case it is translated into cMul(vec2(5.0, 0.0), z).
- Functions 'sin', 'cos', 'log', 'exp' can be used.
Color Map
The goal here is to give each complex number a color. In principle,
you can use any picture to cover the complex plane. However, the
resulting function plots are usually not easy to interpret. Also,
the picture cannot cover the whole infinite plane, and thus we need
a more systematic way.
For a complex number ,
we encode its argument
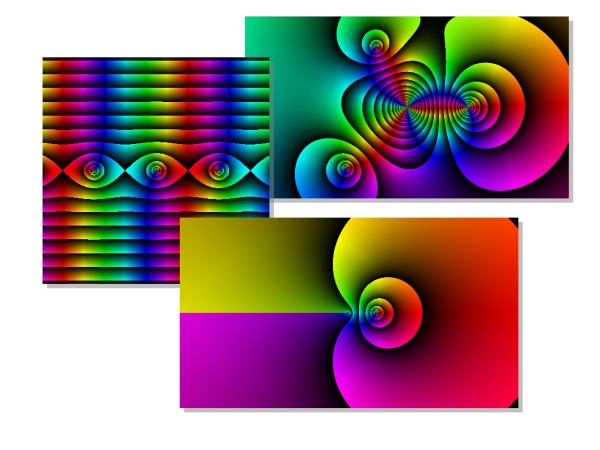
in color hue chosen from a smooth color sequence (color gradient). While we encode its absolute value
in color brightness.
You can choose different color gradients for encoding the argument. Two common gradients are shown in the image above.
The first one interpolate between three colors; black, red and yellow while the second one spans the whole spectrum.
The first gradient facilitates determining the degree of zeros and poles of the complex function.
For the brightness, one choice is to assign full black to zero absolute value
and full white to absolute values greater than a threshold and interpolate in between.
Another choice is to use the fractional part of the logarithm absolute value
.
Taking the logarithm has the advantage of balancing blow-up effect near poles
while taking fractional part part makes a periodic mapping between
the infinite absolute values and the brightness values which are limited between zero and one.
We have implemented two color maps using the two aforementioned color
gradients for argument combined and the fraction logarithmic brightness for absolute value.
float PI = atan(1.0)*4.0;
float cAbs(vec2 z);
float cArg(vec2 z);
vec4 complexToColor(vec2 w)
{
float phi = cArg(w);
if (phi < 0.0)
phi += 2.0 * PI;
phi = degrees(phi);
vec4 hue = vec4(0.0);
vec4 c1 = vec4(0.0, 0.0, 0.0, 1.0);
vec4 c2 = vec4(1.0, 0.0, 0.0, 1.0);
vec4 c3 = vec4(1.0, 1.0, 0.0, 1.0);
if (phi >= 0.0 && phi < 180.0)
{
float s = (phi) / 180.0;
hue = c2 * s + (1.0 - s) * c1;
}
else if (phi >= 180.0 && phi < 360.0)
{
float s = (phi - 180.0) / 180.0;
hue = c3 * s + (1.0 - s) * c2;
}
float r = cAbs(w);
float brightness = fract(log2(r));
return brightness * hue;
}
vec4 HSVtoRGB(float h, float s, float v)
{
int i;
float f, p, q, t;
vec4 RGB;
if (s == 0.0)
{
RGB.x = RGB.y = RGB.z = v;
RGB.w = 1.0;
return RGB;
}
h /= 60.0;
i = int(floor(h));
f = h - float(i);
p = v * (1.0 - s);
q = v * (1.0 - s * f);
t = v * (1.0 - s * (1.0 - f));
if(i==0)
{
RGB.x = v;
RGB.y = t;
RGB.z = p;
}
else if(i==1)
{
RGB.x = q;
RGB.y = v;
RGB.z = p;
}
else if(i==2)
{
RGB.x = p;
RGB.y = v;
RGB.z = t;
}
else if(i==3)
{
RGB.x = p;
RGB.y = q;
RGB.z = v;
}
else if(i==4)
{
RGB.x = t;
RGB.y = p;
RGB.z = v;
}
else if(i==5)
{
RGB.x = v;
RGB.y = p;
RGB.z = q;
}
else
{
RGB.x = 1.0;
RGB.y = 1.0;
RGB.z = 1.0;
}
RGB.w = 1.0;
return RGB;
}
float PI = atan(1.0)*4.0;
float cAbs(vec2 z);
float cArg(vec2 z);
vec4 complexToColor(vec2 w)
{
float r = cAbs(w);
float brightness = fract(log2(r));
float phi = cArg(w);
if (phi < 0.0)
phi += 2.0 * PI;
float hue = degrees(phi);
return HSVtoRGB(hue, 1.0, brightness);
}
Switching Between Functions and Color Maps
After reading the list of functions from the user, we translate each
of them into GLSL shader. We also load our shaders for color mapping.
All shaders are then compiled. Now to visualize a specific function with
a specific color map, we only need to create a new program (shading program),
attach the appropriate shaders ,link that program and use it.
Of course, we need to retrieve the location of uniform variable windowToComplex each time we change the program.
Compilation
The program is written in c99. It should compile and work on Linux, Mac OS X and Windows (using MinGW).
On Linux and Mac, the following should be installed: Glut library, Glew library, lex tool, yacc tool.
On windows (using MinGW), nothing is needed as they are already included in directory 'Win32'.
For running the program, the computer should have a GPU with a driver that support GLSL version 1.2 at least.
Known Issues:
On windows, scroll button doesn't work. It is a problem of Glut library on windows.
Usage
- The program reads input from 'stdin' line by line.
- Each line specifies a complex function to be rendered.
- If you use keyboard for input, remember to end the input by pressing 'Ctrl+D'.
- Input can be redirected from other sources using command line redirecting operators '|' '<'.
- As an example, you can use the following command to read functions from file './res/misc.data': ./coloring.exe < ./res/misc.data
- An interesting usage of the program is using it to see how the tylor series converges to their corresponding function as you add more and more terms. The file exp_tylor.data lists Taylor series for the exponential function up to 20 terms.
Final Note
This project is part of a larger one aiming at visualizing different classes of complex functions using GPU:
- Fractals like Mandelbrot set and Newton fractals.
- Complex functions of a single complex variable (this article).
- Complex functions defined on a unit sphere like spherical harmonics.
- Complex functions defined in 3D space using Marching Tetrahedra method.
You are welcomed to visit the project webpage and check the report and the codes.
This member has not yet provided a Biography. Assume it's interesting and varied, and probably something to do with programming.


 General
  News
News  Suggestion
  Question
  Bug
Bug  Answer
  Joke
Joke  Praise
  Rant
Rant  Admin
Admin 


