It’s 2015, do you know how your web applications are behaving in their production environments? Maybe you've got some front-end analytics plugin installed with some server monitoring also configured so you can see the processor and memory utilization of your servers. The outstanding question is: Do you really know what the code is doing? Can you get a snapshot at a point in time of the entire server-farm and analyze line-by-line what the application servers are executing? Memory and processor utilization are wonderful metrics to determine the health of a server, but what about the health of your user's experience? Hardware metrics only tell a part of the story, and there are other important metrics in your web application such as server response time, bounce rate, and sales conversion rates that speak volumes to your business units
DevOps has quickly become the buzzword du jour for the software industry and promotes something that many developers and IT Administrators don’t enjoy: collaboration. According to Wikipedia, "DevOps acknowledges the interdependence of software development, quality assurance, and IT operations". By having all three arms of a technology department collaborating, software products and services can be produced with a high quality bar and operational efficiencies. In this article, we’ll review how IT operations can engage more with a customer’s experience and assist software development in isolating problems in a production environment with no code changes needed from the development engineers. We’ll use the AppDynamics Application Intelligence Platform to help illustrate how these synergies can drive a better product for customers
Web Performance – More Important Than Ever
There is a saying among web developers: performance is a feature. This seems simple and straightforward to the technically savvy, but to the average business analyst it may not ring true. . Some of the anecdotal numbers around this phrase include:
- Google found that a half-second slower page resulted in a 20% drop in traffic – Marissa Mayer, Google IO 2008 Keynote
- Amazon found that a page load slowdown of one second could cost them $1.6 billion in sales each year. – Fast Company
THOSE are numbers and details from the big publicly owned companies in your 401k or mutual fund portfolio that you can trust are taking performance seriously. Google takes page performance so seriously that they’ve added performance as a component of their page rank algorithm.
Ironically, Google’s analytics and web master tools do not provide much insight into the speed of your pages. There is a "Pages / Session" number that is presented on the default dashboard, but that doesn’t show anything about individual page speed.
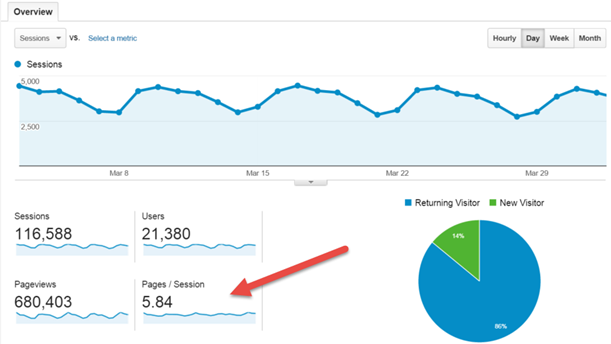
Figure 1 - Google Analytics Dashboard
Google’s Webmaster tools provide some insight into page performance with a graph indicating what the Google web crawler experienced when it requested content from your site. Once again, not very clear on what pages were performing slowly nor clear on any other events going on during the request:

Figure 2 - Google Webmaster Tools - Crawl Stats
We need something that has insight into the inner workings of our application in order to provide better performance instrumentation. If we move to our hosting provider, like Microsoft Azure, I can view information about the processor and memory utilization through the online Azure portal:
Figure 3 - Microsoft Azure Performance Reporting
Nice, and I can add alerts when the CPU is burdened, or the memory is taxed. I can also add to that mix the ability to automatically scale my web application based on these metrics:
Figure 4 - Microsoft Azure Web App Scaling Configuration
Once again, it feels like a shot in the dark: are my customers having a good experience? Are page requests being fulfilled with appropriate responsiveness? I can only monitor the health of my servers, which the folks in IT operations take very seriously. Are the servers taxed because of visitor growth, or because of a lack of performance tuning on the part of the software engineers?
Get the Whole Picture
To get a complete picture of your application, and you will want a holistic view of the entire application if it is mission critical to your organization, you must engage an application platform monitor such as AppDynamics Application Intelligence Platform. This application monitoring platform is similar to the other tools discussed previously in that you do not need to update your application source code to allow it to operate. All of the functionality discussed in this article is available without writing or changing a line of code. This comes straight out of the box.
Unlike the previous examples that expose information about an entire host or just a single request to the application, Application Intelligence measures interactions as a completed business transaction. This granularity of measurement allows us to review the impact of each interaction across the entire platform in a clear systems dashboard.
Figure 5 - AppDynamics Dashboard
Immediately on this dashboard we can quickly review the average response time for the application and review any slower operating elements within our production server environment because they are highlighted in red. This complete overview of the application allows for IT operators to be able to instantly identify their standard server performance, and shows the beginnings of the customer experience within the application.
Why are some services identified as slowing down and highlighted in red? The advantage this tool brings to the game is that there is a customer experience baseline automatically calculated for your application and then measured against. This dynamic calculated baseline is key to verifying that your customers have a uniform experience on every visit.
When an operator finds that the application is performing outside of normal parameters, they can begin investigations from this dashboard.
From this view, we can drill down on a specific transaction and see how its data flowed through the entire platform:
Figure 6 - Transaction Data Flow Through the entire platform
When viewing a transaction at this level, it becomes easy to see that there is significant slowness interacting with the database, with ADO.NET transactions from the PaymentWS node on the bottom right taking more than 16 seconds to complete. Our operators can click the ‘Drill Down’ indicator over the PaymentsWS node and review those interactions in more detail:
Figure 7 - Details of a Checkout interaction with the SQL database
We can see two things happening in this view, the connection open step is taking almost five seconds to complete, and an ExecuteNonQuery call (highlighted in blue) is taking longer than five seconds. The next analysis point available is what got me the most interested in this tool: I can inspect that exact SQL statement:
Figure 8 - SQL Code Review
This is where my bread is buttered: I can now take real action on this code with my database administrator. We have concrete metrics about performance of this query and how it is being used within the platform. At this point, a developer and database administrator can decide whether to optimize this query or to optimize the database indexes to improve the performance of the application.
Oh, and we can also check the performance of that credit card processing HTTP call to "visa.com" (note: this is not a real address, is not affiliated with VISA, and is presented for demonstration purposes only). Clicking on the MovieProcessingRole Drill Down button leads to a complete stack trace leading to the HTTP call:
Figure 9 - Call Stack for an HTTP Call
Clearly, we can see that the slow-down occurs in the UploadValues and ServiceBus transmission. Inspecting the UploadValues call reflects the HTTP calls that were made to upload data:
Figure 10 - Inspecting HTTP traffic
Now we have a clear picture that the synchronous HTTP transaction is delaying processing by almost three seconds. With this information, we can decide to take action in changing architecture to minimize the impact of this network interaction.
Real Business Metrics
Once customer experience is optimized and monitored, the IT Operations team can then rest easy knowing that their servers are running well and with healthy metrics for memory and processor utilization. However, that’s not the end of the story when it comes to measurements and metrics that we want to collect from our application.
The real metrics the business cares about revolve around costs and revenue. Many business-focused applications already have reports available in back-office applications to show sales numbers and utilization of the application. But what about other lost opportunities that don’t immediately come out on standard sales reports? What about the analysis of those visitors to your application who did not click through a ‘buy’ button or use the application in a way that you expected?
For the marketing and sales groups that are building the business-side of an application, these additional metrics are necessary but very hard to unearth. How do you track what actions were NOT taken in an application? With Google Analytics, I can start to see some of this information using their Visitor Flow feature:
Figure 11 - Google Analytics Visitor Flow Initial Analysis by Country
That gives an interesting starting point, but we can do better. AppDynamics has designed features to support collecting exactly these typetypes of custom business metrics. The average business user doesn’t want to drill down into source code or even know where in a database to extract data from to make business decisions. They’re typically looking for a quick view dashboard that demonstrates the key metrics that they’re looking for. For example, the sales group is very focused on capturing revenue, so a suitable dashboard for an appliance retailer may look like this:
Figure 12 - A Revenue focused dashboard based on a custom metric
This looks good, but it doesn’t feel like something that a sales person could put together quickly. With a little help from a developer friend, a custom revenue metric can be added to the process that can be tracked and presented. Custom metrics can read from any public method call in your code, intercepting calls and recording values without needing to add an extra Windows Event Log metric:
Figure 13 - Creating a custom metric for each time a customer 'checks out'
As this value is collected, we can map it against any other metrics that are already collected about our application visitors. In this case, we are collecting the total amount charged to the customer and the currency that the customer is paying with.
With additional information being collected about business transactions against time, using other known metrics about our visitors we can start to see some interesting trends develop. In the lower right corner of the dashboard, we noticed that curved televisions are seeing a two-to-one sales advantage over flat-screen televisions. Perhaps it’s time to change up the layout of the website to promote those older flat-screen televisions in inventory while back-ordering the curved screens.
Summary
DevOps is a brave new world in 2015, and we need to have our development teams work together with operations to ensure smooth running of our production web applications. However, we’ve seen in our examples that smooth operations and profitable operations are not just the concerns of development and operations. With an advanced system management tool like AppDynamics, business analysts can get the metrics they need to make appropriate decisions to improve the business performance of an application. When the chips are on the table at the end of the day, it’s not the up-time of an application that matters but rather the return on investment on that web application. Advanced metrics and analytics should be a standard tool for you in 2015 to meet those business goals.


