The TeamImprover
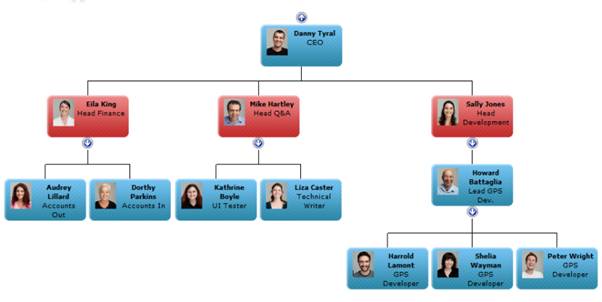
SharePointOrgChart web part is great for displaying your organisation chart
within your corporate SharePoint and works with both server and foundation
versions of SharePoint 2010, SharePoint 2013 and MOSS 2007.
Organisation charts can be drawn from a
SharePoint list, the User Profile Service, a database query or directly from
Active Directory. Please refer to our User
Guides for more details.
The evaluation web parts can be downloaded from here or the
links below:
Using AD as a source for the chart is
especially useful if you have deployed the foundation version of SharePoint but
wish to maintain a centralised organisation chart with other applications.
This article tells you how.
Install the web part (guides here
and here
tell you how) and open a new web part page in Edit Mode. From the custom
category select the orgchart web part and add it into a web part
zone.

Once added the web part will display the
setup wizard. Choose Active Directory from the drop down list of
data sources and give your organisation chart a name.
Pressing Next>> will
take you to the next applicable step. In this case it is selecting the active
directory attributes to be displayed in each box. AD exposes a lot of
attributes so it is quite an unwieldy list. Selecting two or three fields normally
gives the best results. In this example displayname and title have
been selected.
Pressing Next>> moves the
wizard on a step allowing you to set look & feel styling properties. The
web part exposes a lot more properties in the traditional web part
configuration settings, however these basic properties allow you to pick your
style quickly.
To see a full list of properties available
visit the properties page on our site here
and see the User
Guides for more information on the other features available.
Once you have selected a style and pressed done
you will be presented with your organisation chart!
| By default the organisation chart web part will look
for the current user (you!) and then find his or her manager using the manager
AD attribute and draw the chart from that point.
A frequent requirement is to start the chart at a
specific position, for example at the CEO level. To do this you simply put
the web part into Edit Mode and then set the Data Source > start Value property
to either the account name or distinguished name of the person you wish to
begin with.
|
|
The TeamImprover
SharePoint Org Chart is packed with features. You can use the conditional
formatting rules to change the contents of individual boxes. In this example a
rule has been set to check the AD flag AccountDisabled
Which when applied highlights the people
with disabled accounts in the chart. The conditional formatting can be used to
easily differentiate between different types of worker (contract, interns,
part-time) and different grades allowing you to bring your chart to life.
The data
rules section allow you to filter chart data without having to
have access to the source. Which is great for excluding all those test or
redundant accounts that might have sneaked into your corporate AD!
Also included in the package is a search
and information web parts. These combine with the TeamImprover SharePoint Org
Chart web part to allowing your end users to search the chart and find
information quickly.
Download the free
evaluation web part today and begin creating a great organisation chart app
for your end users! Or visit TeamImprover.Com to
find out more information.
Located in the small Oxfordshire village of Chinnor TeamImprover.Com is a software development company specialising in the development of Microsoft SharePoint web parts that are designed to help manage teams more effectively.


