Introduction
In the first part, we learned how to use Crossfilter to manipulate data arrays. In this part, we'll start to use dc.js to render charts and make a simple interactive dashboard.
Background
This is the second article of a 4 part series. You can find my other articles here:
Using the code
Now that we have some basics out of the way, let's get started by creating our first graph. I'll be using the latest dc.js 2.0 for the examples. When using d3.js, make sure you are using the following meta in your head tag or it might have trouble with some characters. Below are the inclusions. Since dc.js relies on d3 and crossfilter, we need to make sure we reference those too. I've added jquery since you never really know when you'll need it. Don't forget to add the dc stylesheet as well or your graphs will look a little weird.
<meta http-equiv="content-type" content="text/html; charset=UTF8">
<script src="https://ajax.googleapis.com/ajax/libs/jquery/1.10.2/jquery.js" type="text/javascript"></script>
<script type="text/javascript" src="js/d3.js"></script>
<script type="text/javascript" src="js/crossfilter.js"></script>
<script type="text/javascript" src="js/dc.js"></script>
<link rel="stylesheet" type="text/css" href="./css/dc.css" media="screen" />
To illustrate a specific scenario, we're going start off with a specific data set which we'll change in part 3 when we start doing more advanced stuff.
The inspiration for this graph is everyday our servers get hit. We want to draw a simple line graph showing how many hits we get per day, some are valid (200s), some are redirects (302s) and some are broken links (404s). The way the data is layed out is very concise.
var data = [
		{date: "12/27/2012", http_404: 2, http_200: 190, http_302: 100},
		{date: "12/28/2012", http_404: 2, http_200: 10, http_302: 100},
		{date: "12/29/2012", http_404: 1, http_200: 300, http_302: 200},
		{date: "12/30/2012", http_404: 2, http_200: 90, http_302: 0},
		{date: "12/31/2012", http_404: 2, http_200: 90, http_302: 0},
		{date: "01/01/2013", http_404: 2, http_200: 90, http_302: 0},
		{date: "01/02/2013", http_404: 1, http_200: 10, http_302: 1},
		{date: "01/03/2013", http_404: 2, http_200: 90, http_302: 0},
		{date: "01/04/2013", http_404: 2, http_200: 90, http_302: 0},
		{date: "01/05/2013", http_404: 2, http_200: 90, http_302: 0},
		{date: "01/06/2013", http_404: 2, http_200: 200, http_302: 1},
		{date: "01/07/2013", http_404: 1, http_200: 200, http_302: 100}
		];

var ndx = crossfilter(data);
Now when we start dealing with dates, we need to make sure dc.js knows it is a date. There are so many different ways to formulate a date, we need to tell it how to interpert the data. Here we loop through each entry in the array and set date as an actual date variable. You can see here for the parsing, some of d3.js makes its way through into our code through the d3.timeformat class. Since our data doesn't have a total entry, we're going to need to add one. I've added a print function so we can see what our new array looks like.:
var parseDate = d3.time.format("%m/%d/%Y").parse;
data.forEach(function(d) {
	d.date = parseDate(d.date);
	d.total= d.http_404+d.http_200+d.http_302;
});
print_filter("data");
"data(12) = [
	{"date":"2012-12-27T05:00:00.000Z","http_404":2,"http_200":190,"http_302":100,"total":292},
	{"date":"2012-12-28T05:00:00.000Z","http_404":2,"http_200":10,"http_302":100,"total":112},
	{"date":"2012-12-29T05:00:00.000Z","http_404":1,"http_200":300,"http_302":200,"total":501},
	{"date":"2012-12-30T05:00:00.000Z","http_404":2,"http_200":90,"http_302":0,"total":92},
	{"date":"2012-12-31T05:00:00.000Z","http_404":2,"http_200":90,"http_302":0,"total":92},
	{"date":"2013-01-01T04:00:00.000Z","http_404":2,"http_200":90,"http_302":0,"total":92},
	{"date":"2013-01-02T04:00:00.000Z","http_404":1,"http_200":10,"http_302":1,"total":12},
	{"date":"2013-01-03T04:00:00.000Z","http_404":2,"http_200":90,"http_302":0,"total":92},
	{"date":"2013-01-04T04:00:00.000Z","http_404":2,"http_200":90,"http_302":0,"total":92},
	{"date":"2013-01-05T04:00:00.000Z","http_404":2,"http_200":90,"http_302":0,"total":92},
	{"date":"2013-01-06T04:00:00.000Z","http_404":2,"http_200":200,"http_302":1,"total":203},
	{"date":"2013-01-07T04:00:00.000Z","http_404":1,"http_200":200,"http_302":100,"total":301}
]"
The dimension that we've been using with crossfilter will end up being our X-axis. Since we want our x-axis to be a timeline, we'll create a date dimension. For our y-axis, we want to show the total number of hits, for this we'll need to setup a key-value format which we can do with a group.
var dateDim = ndx.dimension(function(d) {return d.date;});
var hits = dateDim.group().reduceSum(function(d) {return d.total;});
### TIP
Dc has a nice function so we can shorten the syntax up a bit by using dc.pluck instead of an inline function:
var hits = dateDim.group().reduceSum(dc.pluck('total')); ###TIP
The last bit of data we need for our chart is the range for x-axis. For this, we want to get the min and max date in our array. We can do this by using the crossfilter functions to get the bottom value and the top value for the date column.
var minDate = dateDim.bottom(1)[0].date;
var maxDate = dateDim.top(1)[0].date;
With the data set, we need to setup the chart itself. We need to setup a DOM element. This DOM element needs to load before all the JavaScript which means, it needs to be placed on the page first or you need to wrap the JavaScript code in something like JQuery so it only loads after the page full loads.
<div id="chart-line-hitsperday"></div>
Next we associate our chart with the DOM element.
var hitslineChart = dc.lineChart("#chart-line-hitsperday"); We set the charts dimension (x-axis), group (y-axis), and range
hitslineChart
	.width(500).height(200)
	.dimension(dateDim)
	.group(hits)
	.x(d3.time.scale().domain([minDate,maxDate]));
And finally, we tell dc to render it.
dc.renderAll();
Beautiful isn't it? So you can see what the source code actually looks like and how it renders and behaves, I've created a jsfiddle. Just click on the image and you can see it fully working.
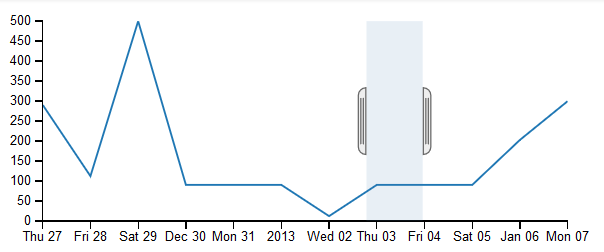
You'll notice that you can't hover over a point in the graph to see its value. Instead you get a selector object. This is called a brush. By default, it is turned on. We can turn it off by adding the following to the chart attributes.:
.brushOn(false)
We can also give the yaxis a label:
.yAxisLabel("Hits per day")
If you notice the dates, I purposefully had the data span two years. We're now going to add a pie chart to our dashboard that shows us the total hits for the year and then allow us to select the year. First we need to create a Year column for us to create a dimension on. We'll add it to our other column generations.
data.forEach(function(d) {
	d.date = parseDate(d.date);
	d.total= d.http_404+d.http_200+d.http_302;
        d.Year=d.date.getFullYear();
});
Next we create the dimension and then sum up the yearly totals.
var yearDim  = ndx.dimension(function(d) {return +d.Year;});
var year_total = yearDim.group().reduceSum(function(d) {return d.total;});
With this info, we can create the DOM object, its reference and graph the pie chart. You'll notice that the chart is of type pieChart.
<div id="chart-ring-year"></div>
var yearRingChart   = dc.pieChart("#chart-ring-year");
yearRingChart
    .width(150).height(150)
    .dimension(yearDim)
    .group(year_total)
.innerRadius(30); 
The two charts are tied too each other through cross filter, so clicking a year will automatically filter the line graph with no extra code! Since we have all the data for the individual statuses, it seems a shame to waste that data. Let's enhance the chart a bit more. Instead of just a single total group, we'll create one for each status type:
var status_200=dateDim.group().reduceSum(function(d) {return d.http_200;});
var status_302=dateDim.group().reduceSum(function(d) {return d.http_302;});
var status_404=dateDim.group().reduceSum(function(d) {return d.http_404;});
We'll swap out the total with the status_200 group and stack the other groups on top. The second argument sets the label for the series, so we'll just shorten it to the status value itself. To make it look a little prettier, we'll switch it to an area chart by just setting the renderArea attribute to true.
To finish up, we'll also give it a legend. The legend needs a legend object, so we'll create one and position it in the top left corner.
hitslineChart
   .width(500).height(200)
   .dimension(dateDim)
   .group(status_200,"200")
   .stack(status_302,"302")
   .stack(status_404,"404")
   .renderArea(true)
   .x(d3.time.scale().domain([minDate,maxDate]))
   .brushOn(false)
   .legend(dc.legend().x(50).y(10).itemHeight(13).gap(5))
   .yAxisLabel("Hits per day");
I should have made the data a little nicer, but you get the idea. :)
We've covered two charts that interact with each other. However, dc.js isn't just about charts. It can also do tables. With most of the other libraries, a datatable is normally left out. This is another reason I like dc.js so much.
To create a table, we need to first create some structure for it, so it's a little different then just a simple div like the charts. However, chart titles - not to be confused with point labels also called titles, aren't included in the rendered divs either.
I've included a little bit of style on the encapsulating div so it doesn't overlap our charts. Then I've given our table a header and an id so we can have dc reference it.
<div style='clear:both;'>
		<table id="dc-data-table">
			<thead>
			<tr class="header">
				<th>Day</th>
				<th>TPS 200</th>
				<th>TPS 302</th>
				<th>TPS Total</th>
			</tr>
			</thead>
		</table>
</div>
Just like our previous dashboard elements, I've referenced the DOM object it is associated with and we give it a dimension and a group. In this instance, the group is used to organize the table data as you can see in the example. As far as I know, it is not possible to leave the grouping out and just have a flat datatable. The next attribute are the columns. You'll want to make sure the columns values line up with the values we've set in the header.
var datatable = dc.dataTable("#dc-data-table");
datatable
.dimension(dateDim)
.group(function(d) {return d.Year;})
.columns([
function(d) { return d.date.getDate() + "/" + (d.date.getMonth() + 1) + "/" + d.date.getFullYear(); },
function(d) {return d.http_200;},
function(d) {return d.http_302;},
function(d) {return d.http_404;},
function(d) {return d.total;}
]);You should now be able to see the table render and react to updates in the chart!
This covers some of the basics of dc.js. Stay tuned for part 3 where we cover some more advanced features.
History
Keep a running update of any changes or improvements you've made here.
I'm a Principal Performance Engineer who uses VB.Net, HTML, CSS, etc. to write automation tools and reports.


 General
  News
News  Suggestion
  Question
  Bug
Bug  Answer
  Joke
Joke  Praise
  Rant
Rant  Admin
Admin 


 Also, dc does not support .pluck() anymore. (I've confirmed this exploring the dc object in the browser console)