Introduction
Performance
is something that you should be thinking about during development,
rather than just when you’re debugging, but it is often considered a “black
art”, fueled by guesswork and necessity.
Developers
often rely on their gut instincts, and focus on sections of code that they think
are slow. The danger here is that you might end up with a 100x speed-up
(great!) on a section of code that only contributes to 1% of the overall
experience (not so great). Or even worse, your speculation might just be
flat-out wrong, and there’s no problem where you looked.
This way
of optimizing is painfully slow, boring, and quite frankly, expensive. At the
risk of stating the obvious, if you want to avoid wasting time hunting for the
real issues, then when the time comes to optimize, don't speculate. Measure
where the time or memory is being spent using one of the many tools and profilers
available, and focus your time and energy where a change will have the maximum impact
on the overall performance of the system.
That’s a
principle I’m going to come back to through this article – guesswork is
pointless, and there are tools out there that let you zero right in on your
problems, so use them! With that in mind, I’m going to describe some of the
most fundamental techniques and tools you should use to ensure you’re
maximizing the performance of your ASP.NET applications, so let’s get started…
Factors in Performant Applications
Writing code that isn’t a slouch is something within the reach
of all developers and, with the right tools and some practice, it’ll become
second nature to you. It really helps if you’re considering performance, not as
an afterthought (when issues will be much costlier to resolve), but as part of
day to day development.
Let’s quickly summarize a few reasons why you really should
care about your application’s performance up-front:
- If your users get a poor user-experience, become frustrated, and
start complaining, then you have to spend days debugging instead of writing new
code.
- Cost! There are generally two ways to making an application
faster: spending more money on hardware (this is even more true in the
cloud-web world where a poorly tuned SQL query might lead you to buying a whole
new database server unnecessarily), or fixing your code.
- Once performance becomes a problem in production, it can involve
architectural rework to fix, which is not only painful, but also pulls you away
from new work.
- It’s satisfying to see a job done well first time round, and to know
that your users love using your application.
Let’s assume that, if you’re still reading, you probably
appreciate the benefits of optimizing your ASP.NET application for improved
performance. Broadly speaking, there are three areas which are going to affect
your application’s performance:
Perception
Let’s face it; the vast majority of applications don’t need
to be built with extreme speed in mind, they only need to be fast enough.
Although that said, I’ve yet to find a user that doesn’t complain about speed,
no matter how fast the application is. Humans are a curious bunch.
However, the key thing to remember is that the important
point of view when you’re tracking down performance issues is the user’s
point of view – always make sure you’re focusing your energy on problems which
will affect the user, rather than bits of code which you think might be
running slowly.
Compilation and Configuration
To get the best out of your application, compile the code
correctly and configure the system with debug features disabled. Compiling the
code in non-debug mode and with the highest level of optimization will make
sure that the compiler generates more efficient code (this has other
repercussions, but that’s a story for another day). On byte code systems like
.NET, debug features will prevent the JIT compiler from emitting the most
effective code, as the generated code will have extra information for debugging
purposes and will not be fully optimized.
At the same time, make sure your application and target
environment system are correctly configured to maximize performance. For
example, a few things you should consider include: keep logging level at an
appropriate level for a production system (so we don’t incur an unnecessary overhead),
enable compression (even for dynamic content), and have a sensible caching
strategy for static content.
The Code
The fastest code is the code that doesn’t run at all. However,
since code that is not executed would not be very useful, when code is written
it should be written with performance in mind, so let’s take a look at how we
can get the most out of what we write.
Tools and Techniques
I am a firm believer in the maxim of Make
it Work, Make it Right, Make it Fast (in that order), but
even when you start working on “Fast”, it can be easy to start looking for the
problem in the wrong place. Of course a good place to start is to try and avoid
the worst of the problems altogether through best practices.
General Best Practices
As with most things, the key to achieving high performance
is education. Developers should know and use good coding and architecture practices,
and while some of these guidelines will be obvious to many of you, it’s always
worth getting a reminder. Of course, following these guidelines is still not a
guarantee that the code will perform well, but it will certainly increase the
odds!
- First of all, you should be aware of the Fallacies of distribute computing in order to be able to avoid the traps they lead you
into.
- Next, you should know your data structures, when it’s appropriate
to use them, and what the costs of using them are in terms of memory and
access time (are they constant, linear or exponential…).
- You should understanding the cost of accessing disk vs. the cost
of reading data from memory vs. from the network, since the differences in
speed can be in orders of magnitude.
- But most importantly, keep learning about – and adhering to - commonly
held development guidelines, like doing the paging and sorting on the database
instead of doing it in code, using caching appropriately, making sure the
database is properly indexed , minifying and bundling CSS and JavaScript files
into a single file to reduce network connections, etc. To get you started,
there are resources like Stack Overflow and compilations of tried-and-tested
performance advice from other developers. Red Gate has
published one such compilation as a free eBook called 50
Ways to Avoid, Find and Fix ASP.NET Performance Issues.
Of course, even when these guidelines are followed and best
practices are used, mistakes are bound to happen, and the sooner you catch them
the less impact they will have. And more importantly, the easier they’ll be to
fix.
I tend to use two tools to catch most problems while the
code is being developed. To start with, many performance problems originate at
the database level, so let’s tackle that layer first:
SQL Profiler
One of the techniques I use during development is to have SQL profiler constantly open while the application
is being used (to use this effectively, more than one monitor is advised to
make it easy to monitor your application and database simultaneously), so I can
constantly track the queries being executed. By taking a quick look at the SQL
activity, I can easily spot some things without much effort:
- The number of calls being made - If I see many queries in
a single request/action, then perhaps there are good candidates for caching, or
perhaps there is some lazy loading in action where I should instead use eager
loading or prefetching in order to make fewer database calls. ORMs help a great
deal during development, but it’s very easy to (unknowingly) abuse the database
without realizing what is going on under the hood. Having a profiler active is
a great way to way to keep things in line.
- Slow Queries - if we see queries taking too much time, then
perhaps an index is missing, the query is not optimized, or there is a bad condition
on a join.
- Data overload - If too much data is being returned,
perhaps paging is either lacking or being mis-handled.
- Too many physical reads – if I’m seeing a lot of physical
reads resulting from queries, the probability of a missing index is high.
One thing to take away from this is that it is important
that you have a realistic data set for testing during development, otherwise any
problems related to your database (e.g. data structures, configurations,
optimizations) will be very hard to spot.
Of course, if your team uses a shared database for
development (which is something that you should definitely consider), you
should be careful to filter your data so that you’re monitoring only the calls
being made by your machine/database user.
Now that you’ve got a way of keeping an eye on your application
data store during development, you need a way to monitor the application code
itself, so let’s move along.
Glimpse
Another tool that I use a lot while developing is Glimpse.
It is an open source ASP.NET module (yes, it’s free) that allows you to easily see
a huge amount of information about your application code and server. For
example, Glimpse gives you instant visibility into your request data (the
request parameters, the configured routes, server variables, sessions), your
server’s configuration and environment, the pipeline and methods that were
called (including their timings), and AJAX calls – just as a start.
Glimpse does this in a lightweight and un-intrusive way; the
data can be inspected right within a web browser, with the information
superimposed on the bottom right of the window (Figure 1), ready whenever you
need it.
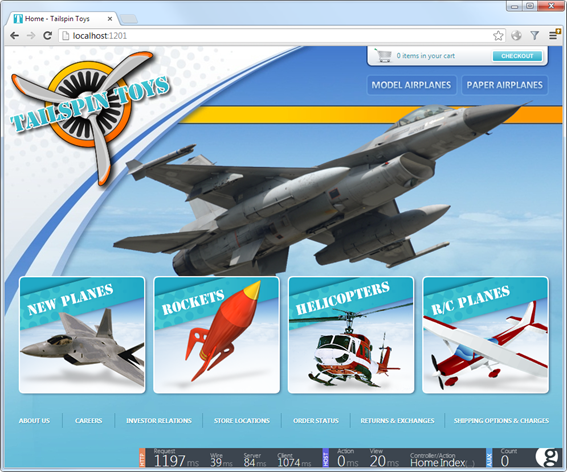
Figure 1- Glimpse minimal data
seen on the left bottom of the screen
In Figure 2, you can see the data summary in more detail; it
has information about both the HTTP request and the code executed on the server
to return this particular page.

Figure 2 - Glimpse summary window
This summary is always available, and you can expand the data
to get more details, as seen in Figure 3. From this example (i.e. the data
about what it took to render the page in Figure 3), we can see that the request
took a total of 1197 milliseconds to serve, of which 39 were spent on the
network transferring information, 84 were spent by the server, and 1074 were
spent on the client rendering the page.
Right away, we can see that approximately 88% of the time is
spent on the client, so perhaps this is something we should optimize first,
since it affects user perception of performance, even if the server is
doing its work at admirable speed.
This is a perfect example of the “Don’t Speculate!”
principle – minimal effort expended, and we’re already better informed about
where to look for performance improvements.
Figure 3 - Expanding the summary (browser request)
This is just the tip of the iceberg, as not only does
Glimpse provide deeper details than what we’ve briefly looked at here, it supports
a plugin system, so you can install extensions to provide details about
specific components/systems. For example, instead of using the SQL profiler, we
can use an Entity Framework plugin display the SQL command(s)
that have been executed by the application, as well as their duration and the
parameters (Figure 4). Although this is handy, be aware that the data in
Glimpse is not (currently) as rich as the information that SQL profiler
provides.
Figure 4 - details window. Seing
the SQL executed on a request (click for an extended view)
At the time of this writing, taking a quick look at the
official nugget repository, we can find 39 Glimpse
packages (even if we exclude the core packages, it’s a lot of
extensions), so chances are, you’ll find something to help you quickly target
exactly the right problems in your own application.
Adding glimpse to your ASP.NET application, is as simple as installing
the appropriate package from the official nuget repository,
and by default it only works against your local server, so it won’t be enabled
on production systems.
Profiling
Even when code is developed conscientiously, it is almost
guaranteed that some things will be slow. For example, after you do load testing,
or when your application is required to scale unexpectedly, you might realize that
the code doesn’t perform or scale as well as expected. This might happen
despite your best intentions, best practices, and most rigorous application of
performance optimizations.
As we discussed at the start of the article, when that time
comes, you better have some tools that allow you to measure and understand
where the time is being spent, so you can focus your optimization efforts where
you can really make a difference.
If your application is not yet in production, then bravo for
being pre-emptive about writing the best code you can! However, bear in mind
that you can only rely on (educated) guesses about how it will be used and how
it will behave. Based on the typical profile of your expected users, try to anticipate
how they will use the application. Do as many profiling sessions as there are expected
usage patterns, and work from there.
If the application is in production, then we have
some real data regarding what the most used functions are, so we can focus on
them first (optimizing a slow part of the application that is used once or
twice a month is one of the traps we mentioned earlier - a waste of resources).
You can find these common functions by analyzing application logs or, if your application
is using a telemetry application, via data you already have ready to use.
Once you’ve used your data to work out where to start
looking, profile and optimize the slowest high-usage functions first (for the
biggest gain), and then profile again, and go after the remaining culprits,
until optimization is no longer cost effective. Sure, this sounds like a bit of
a slog, but I guarantee it’ll be faster than guessing and using timing
statements!
Note: The actions I’m
describe here can be performed with most of the profilers available on the
market (including what’s build into Visual Studio); however I’ll use Red Gate ANTS Performance Profiler to illustrate
some of the points, as it’s the only one that lets you relate data access
activity directly the .NET code triggering it, which means I can close in on
the root cause of problems much faster, and with a minimum of trouble. I’ve also
found it to contain a nice balance between ease of use and extensive
functionality.
The beauty of using with ANTS
Performance Profiler (over manual timing statements or guesswork) is that every
run through the profiler assesses the whole application and narrows down the
list of potential problems. So no more guesswork, and no more speculation –
they just aren’t necessary anymore.
Some Notes on Code Profiling
It’s worth taking a step back to look at profiling in more
detail, as it’s arguably the most powerful tool at your disposal. Profiling an
application is typically done along two different vectors:
- Profiling memory usage, in order to find memory leaks,
which can severely impact an application’s performance. Or, alternatively, to
optimize memory usage (if you use too much memory the application can be
constrained by physical or virtual memory). By using less memory, you can
reduce memory paging, improve process cache usage and, more importantly, put less stress on the garbage collector.
- Profiling performance, in order to find performance
bottlenecks, and code hotspots (code paths which take more time than others - Figure 5). A good profiler should be able to understand not only where time is being
spent in code itself, but also be able to understand when calls are made to
external systems (like a call to another server via HTTP), to a relational
database, or queuing systems. With this information, if you have some calls
that are slow, you can at least identity where the problem is and try to work
around it.
And as for calls to database systems, your profiling tool of
choice should be able to let you examine the queries that were made (and
hopefully the amount of data that has been returned). Ideally it should have
the capacity to understand SQL (Figure 6) and be able to group the same queries
(with different parameters) so you can concentrate your efforts on optimizing
the most critical queries (i.e. the ones most called and with the greatest impact.)
Figure 5 - Watching the call
tree and viewing the hotspots
Figure 6 - viewing the SQL queries executed by the application
Just to be clear, even a powerful tool like ANTS Performance Profiler can sit alongside the
SQL Profiler monitoring we covered earlier. The SQL Profiler is a focused tool
for a single, specific purpose, and is well suited to continuous monitoring. On
the other hand, ANTS Performance Profiler is intended to give you a holistic
understanding of your application, with the ability to drill into your .NET
code or data access layer.
Conclusion
Let’s briefly run through the salient points we’ve covered:
- You
should be thinking about performance right when you start writing code.
- Performance
is a result of user perception, application compilation / configuration, and
the code itself (in conjunction with the database and external services).
- Education
is key to optimizing your code – make sure you know and understand common best
practices.
- Always
keep an eye on how your code is interacting with your database and other
external services. You should do this as your developing, and bear it in mind
when you get into troubleshooting and dedicated optimization.
- Use
tools like Glimpse and SQL Profiler to give you constant awareness of how your
application is performing, with the data to help you drill down the second you
spot a problem.
- Inspect
and profile your application - don’t use speculation, manual timing
statements, or guesswork to figure out where performance problems are. Use the
tools at your disposal to get a complete understanding of your whole
application, and save yourself a ton of time and pain.


