Content
- Whom is this article written for?
- How do you set about research? General application characteristics
- What to use? Main tools
- About dependencies. Dependency Walker
- About processes. Process Explorer
- About registry and File System. Process Monitor
- Network applications and how to fight with them. Network sniffers.
- Hook utilizing with an example of
CoCreateInstance. - And in conclusion…
- References
Whom is this article written for?
There are situations when you really need to know how an application works, how it implements such and such functionality. For example, you want to integrate your software with some popular system; learn how existent solutions of your problem work; perform smooth compatibility with OS and libraries with all their undocumented functions…
In general, the architecture research comes to utilizing of different tools, which discover how it is all built for us.
This article is mainly for developers. It is rather familiarization one and that’s why it doesn’t concern some specific language or technology. Here you can find the description of working with some tools that can help to learn the application internal structure. I’ve also included an example of hook lib code, but it doesn’t require some deep development knowledge.
How do you set about research? General application characteristics
Whatever research you start first of all you have to formulate the goals for it clearly. Here we can mention the most common ones, but each specific task can add more specific goals:
- Comparison of an application with its external.
- Search for weak points in the given architecture.
- Reconstruct application communication rules, its architecture to integrate it with your software, etc.
So, what shall we start with?
I start each research with the application installation and watching it in action. In fact I perform the small testing that gives me not only the principles of application functioning but also its problems, bugs (it’s an ideal situation actually – it’s much easier to profit by somebody’s else mistakes). An application is better to be installed on the virtual machine. Thus you can easily rollback and restore if an application crashes the system, and also you should not reconfigure the environment each time when it happens. Virtual machine utilizing also gives a possibility to create your own small network, set-up a domain and so on.
After we enjoyed an application it’s time to fisk it. First we look what files are included in this application’s package, what registry keys it uses and other information like this. All these data will help to orient better when researching architecture. Frequently the unit names can tell about their functionality.
Dependency walker
There is a tool to discover what libraries a binary file uses - Dependency Walker.
This program represents the hierarchical view of dependencies among modules. Dependency Walker scans the import table of the selected (root) module and build the dependency tree for it. After that it proceeds to all dependent modules and builds dependency tables for each of them. Thus it recurrently continues until the dependencies for each module in the tree are built.
Let’s see it by the example of Notepad.exe. Start Dependency Walker and open Notepad.exe in it. We can see such a picture:
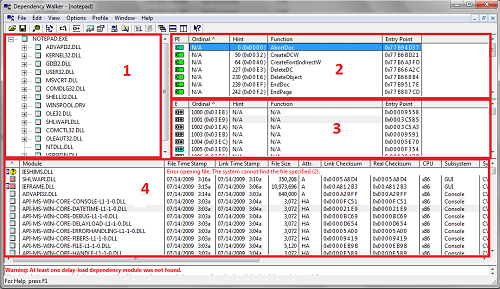
Screenshot 1. Dependency Walker
So what we get:
1 – Dependency tree for the binary opened. There we can see all dependencies for this module, its properties, full file path, its other occurrences in the tree.
2 – Functions imported by the root-module from the child-module. If it’s needed we can search the information about a function by the specified path (http://search.msdn.microsoft.com is used by default) with mouse right-click on the function name using "Lookup function in external help" option.
3 – Exported functions of child-module.
4 – Information about all modules presented in the dependency tree.
The information about modules and specific libraries used can tell about what technologies an application uses. For example, notepad.exe uses GDI to display graphics and not GDIPlus, it also uses COM. We see the functions, which developer used and which we can hook to obtain the additional information. We will talk about hooks a bit later in the example of CoCreateInstance hook, where we will also consider utilizing of Detours by Microsoft.
Process explorer
This program is an advanced process manager. It’s very easy to use and still free. You can download it from Microsoft site. Besides information about processes you can also view statistics for the whole system, but the first point is much more interesting for the research.

Screenshot 2. Process Explorer (Handles of notepad.exe)
The process tree is displayed in the main window of the program, you can also browse ProcessID, CPU, Description, Company Name in the table.
After short testing of the product to be researched we detect its processes. Frequently a product does not have GUI at all and is only represented by one or several processes. So we cannot see it – just analyze its processes.
First we can browse all modules, which are used by notepad.exe, by opening View -> LowerPlaneView/DLLs or simply pressing "Ctrl-D". But I should mention that Dependency Walker described above is better to use for this purpose.
LowerPlane has one more interesting feature. Besides DLLs you can browse Handles. Information about all Files, Keys, Mutants, Events, Process, Threads, etc., which is used by the application, is displayed here. You can see properties for each of them (screenshot 2).
One more Process Explorer feature is "Find DLL or Handle". It gives a possibility to find all processes that use the specified DLL.
Process monitor
This tool is developed by Sysinternals. To tell the truth I’ve never used it much but recently they integrated two previously autonomous programs Registry Monitor and File Monitor into it. Autonomous programs were available only for Windows up to XP version. For Windows Vista and Windows 7 they now are the parts of Process Monitor.
Besides these features Process Monitor can also monitor:
- Network Activity;
- Process and Thread Activity;
- Profiling Events.
First let’s discuss Registry Monitor. What is it for?
Frequently an application uses registry for storing its settings or changing system settings for its purposes. Monitoring of registry changes should be performed in two directions:
- registry changes during application installation;
- registry changes during application functioning.
Process Monitoring is good for both. All information can be viewed in the real time. There are also filters to watch the necessary information only.
For the first one of the directions mentioned above you can also use RegSnap, RegShot or other similar tools. They enable making registry snapshots and then compare them.
With File Monitor feature you can monitor all changes in the file system. It is very useful for applications that work with it actively. In particular we can detect the moment when file copying starts. For example, if the researched application downloads user profile from server we can say exactly when it is performed, which files are downloaded at once and which ones – as the need arises. Filters are also available here.
Talking about Network Activity I can mention that personally for me it is easier to use network sniffers. We’ll talk about it in the next section.
Network applications and how to fight with them. Network sniffers
Sometimes it is very useful to learn how active an application uses network. First we can simply look up what ports are used at application start. You can use TCPView for this purpose. This program shows what ports applications create and what protocol (TCP/UDP) is used. But this is just a beginning.
Knowing what ports are created by application we can say nothing about what data are transmitted. As often as not network data sniffing helps to detect the communication protocol between two applications in the network (but only if this protocol is open) and so answer the question about what data are transmitted.
First let’s pay attention on Network Monitor tool by Microsoft. It can be downloaded from the Microsoft official site, has three versions and all of them are free.
This application is easy to use and rather informative. All you need to start working is create New Capture. We can see some peculiarities:
- Network Monitor splits all traffic by processes, Thus we can easily find the necessary process.
- Filters are used. This is a powerful feature: with it you can write pseudocode to filter all data according to the specified rules. For example, the code piece below searches all traffic packages with the specified byte sequence ("0b 0b 01").
ContainsBin(FrameData, 2, "0b 0b 01")
More details can be read in Network Monitor manual.
And as I promised I am going to tell about parser. The matter is that Network Monitor as each sniffer has a data parser. It knows all protocols and thus represents the information in more obvious way. Additional parsers can be downloaded from Microsoft site. After downloading the program options should be updated: go to Tools\Option\Parser, select directories where they were installed to and switch off Stub function (screenshot 3).
By the way, if you are developing an application with your own protocol, you also develop your own parser for Network Monitor.
Screenshot 3.Network Monitor (parsers option)
Let’s try it in action. We’ll take a standard RDP-connection as an example. We start the sniffer, create New Capture and press Start. Then let’s start mstsc.exe and connect to any free machine (or for another virtual machine). We work in this session for a little, close it and stop the sniffer. I’ve got such a picture (screenshot 4) .
Screenshot 4. Network Monitor (mstsc.exe sniffing)
Now we can perform the data analysis.
Another sniffer I want to mention is Wireshark (previously Ethereal). It has almost the same functionality as Nenwork Monitor. But the most interesting feature as for me is "Follow … stream" function. With this function you can select one package and view the full traffic from this address and port, after that you can save it in the required format. Also Wireshark supports saving files in Network Monitor format. Below you can see the results of Wireshark work for the same mstsc.exe.
Screenshot 5. Wireshark(mstsc.exe sniffing)
But both these sniffers have not managed to solve one small problem. To be brief I needed to monitor local traffic. CommView 6.0 turned out to be the best program to deal with this task. You simply select localhost after start, and thus represent all local traffic by processes. So it’s very useful but still have one disadvantage: it is commercial product.
When choosing a sniffer you rely on your own preferences and specific task you have. Nobody prevents you from using all three sniffers but it’s not always convenient.
Hook utilizing with an example of CoCreateInstance
Once I faced with a problem: I had to browse Direct Show graphs, which are built by WindowsMediaPlayer. It didn’t seem to be a difficult task. You can always use such tool as Graph Studio and browse all registered graphs using “Connect to remote graph”(screenshot 6).
Screenshot6. Graph Studio
But the difficulty is that WMP doesn’t register its graphs. I don’t know why it is so, but it is a fact of life. DirectShow manuals present examples of how to register graphs of your own application, but ehhh… WMP was not ours :).
So my task was to change code of the existent application – just for those functions which built graphs.
First question was what part was responsible for graph building. If not to go into details (read MSDN to find them) the one that can build filter graph is IGraphBuilder interface. It is included in DirectShow. Below I put a sample from MSDN, but with a small modifications. Function AddToRot is a method of CRot class. It also has one more method RemoveGraph.
HRESULT CRot::AddToRot(IUnknown *pUnkGraph, DWORD *pdwRegister)
{
IMoniker * pMoniker = NULL;
IRunningObjectTable *pROT = NULL;
if (FAILED(GetRunningObjectTable(0, &pROT)))
{
return E_FAIL;
}
const size_t STRING_LENGTH = 256;
WCHAR wsz[STRING_LENGTH];
StringCchPrintfW(wsz, STRING_LENGTH, L"FilterGraph %08x pid %08x", (DWORD_PTR)pUnkGraph, GetCurrentProcessId());
HRESULT hr = CreateItemMoniker(L"!", wsz, &pMoniker);
if (SUCCEEDED(hr))
{
hr = pROT->Register(ROTFLAGS_REGISTRATIONKEEPSALIVE,
pUnkGraph,
pMoniker,
pdwRegister);
pMoniker->Release();
}
pROT->Release();
return hr;
}
As you can see from code to register a graph we should use interface method IRunningObjectTable::Register.
There are such function parameters:
HRESULT Register(
[in]   DWORD grfFlags,
[in]   IUnknown *punkObject,
[in]   IMoniker *pmkObjectName,
[out]  DWORD *pdwRegister
);
We need only one of them, IUnknown *punkObject.
The function to create interface looks as follows:
HRESULT CoCreateInstance(
__in   REFCLSID rclsid,
__in   LPUNKNOWN pUnkOuter,
__in   DWORD dwClsContext,
__in   REFIID riid,
__out  LPVOID *ppv
);
So, if we are able to watch utilizing of CoCreateInstance function and get the name of created interface, then we will be able to easily check if the interface, which we are interested in, is created or not.
To manage this let’s try to hook the function and monitor interface creation until we get IGraphBuilder. After that we will be able to use AddToRot function and register the created graph.
There are a lot of methods of function hooking. We take ready solutions such as Detours Research Library by Microsoft or mhook.
Detours is free library when we deal with x86. Mhook is absolutely free in any version.
Our example doesn’t include x64 system support and thus Detours will be enough for us. We can even use an example of function hook from its manual. We modify it a bit and the resulting code in main file of our solution is as follows:
#include <windows.h>
#include <detours.h>
#include <iostream>
#include <fstream>
#include <Guiddef.h>
#include "stdafx.h"
#include "Rot.h"
#include "Utils.h"
using namespace std;
wchar_t* clsid_str;
static HRESULT (WINAPI * CoCreateInstanceReal)( __in REFCLSID rclsid,
__in LPUNKNOWN pUnkOuter,
__in DWORD dwClsContext,
__in REFIID riid,
__out LPVOID *ppv
) = CoCreateInstance;
HRESULT WINAPI CoCreateInstanceHooked(__in REFCLSID rclsid,
__in LPUNKNOWN pUnkOuter,
__in DWORD dwClsContext,
__in REFIID riid,
__out LPVOID *ppv
)
{
HRESULT hr = CoCreateInstanceReal(rclsid,
pUnkOuter,
dwClsContext,
riid,
ppv);
if(hr == S_OK)
CheckInterafce ((IUnknown*)*ppv, riid);
return hr;
}
BOOL WINAPI DllMain(HINSTANCE hinst, DWORD reason, LPVOID reserved)
{
if ( reason == DLL_PROCESS_ATTACH )
{
DetourTransactionBegin();
DetourUpdateThread(GetCurrentThread());
DetourAttach(&(PVOID&)CoCreateInstanceReal, CoCreateInstanceHooked);
DetourTransactionCommit();
}
else if ( reason == DLL_PROCESS_DETACH )
{
DetourTransactionBegin();
DetourUpdateThread(GetCurrentThread());
DetourDetach(&(PVOID&)CoCreateInstanceReal, CoCreateInstanceHooked);
DetourTransactionCommit();
}
return true;
}
The only difference between our solution and the example is that we hook CoCreateInstance. In CoCreateInstanceHooked implementation we check interface riid after each CoCreateInstance call.
CheckInterface function receives double pointer to interface and riid and performs checking. If true result is obtained it calls CRot::AddToRot function.
  void CheckInterafce (IUnknown *pv, REFGUID in_riid)
{
	DWORD dwRegister;

if (IsEqualCLSID(in_riid, IID_IGraphBuilder)) \\checking riid. If CoCreateInstance was called for \\IGraphBuilder, we register our graph.
	{

		OutputDebugString(L"\\..........Ok.........\\");	\\ Output debug log
		CRot::AddToRot(pv, &dwRegister);
	}
}
We build the project as Dynamic Link Library (project is attached). Then we register it in Apinit_dlls: copy detoured.dll library and built library of our project for example to C:\. Then go to regedit, find AppInit_DLLs and write paths to our library there (screenshot 7).
Screenshot 7. RegEdit (AppInit_DLLs key editing)
Now we should restart the computer. How to get to know if our hook is applied? We start WMP, and for example Process Explorer, and look what libraries WMP has loaded. Everything was applied as we see: (screenshot 8)
Screenshot 8 Process Explorer(Hook libraries)
Finally we can try it in action. We start WMP and try to connect to the remote graph in Graph Studio: (screenshot 9)
Screenshot 9. Graph Studio (Windows Media Player graphs)
So when video starts in WMP we can see graphs that are built. Thus we solve the problem with hooks that changed application behavior.
All functions can hooked in the same way, with Detours. Sometimes there can be a situation when the process with the function to be hooked is loaded earlier than our library and so the hook does not work. There are other approaches to fight this situation, but we’ll talk about them in other occasion.
And in conclusion…
Researching is a huge theme with a number of methods and approaches. In dependence on application technologies, level of execution etc. the methods of researching its architecture will vary. Frequently we can learn about application internal structure just looking to its internals, and here you can’t do without reverse engineering, but actually it is even much bigger theme than the one described in this article.
References
ApriorIT is a software research and development company specializing in cybersecurity and data management technology engineering. We work for a broad range of clients from Fortune 500 technology leaders to small innovative startups building unique solutions.
As Apriorit offers integrated research&development services for the software projects in such areas as endpoint security, network security, data security, embedded Systems, and virtualization, we have strong kernel and driver development skills, huge system programming expertise, and are reals fans of research projects.
Our specialty is reverse engineering, we apply it for security testing and security-related projects.
A separate department of Apriorit works on large-scale business SaaS solutions, handling tasks from business analysis, data architecture design, and web development to performance optimization and DevOps.
Official site: https://www.apriorit.com
Clutch profile: https://clutch.co/profile/apriorit
This member has not yet provided a Biography. Assume it's interesting and varied, and probably something to do with programming.


