Previously in this series, we built, automated, and deployed a complex Node.js application to a Kubernetes cluster on Azure. Now, how do we ensure this job listing application is operating smoothly?
Ensuring your applications run properly after deployment is critical to any business, especially on the cloud where you have Kubernetes clusters and other components. Azure Monitor provides you with the insight you need to understand the performance and health of your Kubernetes cluster and container workloads.
We’ll build upon the previous project, which has a deployed Kubernetes cluster running on Azure Kubernetes Service (AKS). We’ll add monitoring to our deployed application, then learn how to scale up to meet increased demand.
Enabling Monitoring
Once you have a Kubernetes cluster on AKS, you have several options to enable monitoring.
We’ll use the Azure CLI to enable monitoring like this:
az aks enable-addons -a monitoring -n [CLUSTER-NAME] -g [RESOURCE-NAME]
For example:
az aks enable-addons -a monitoring -n nodejsonaksapp -g nodejsonaks
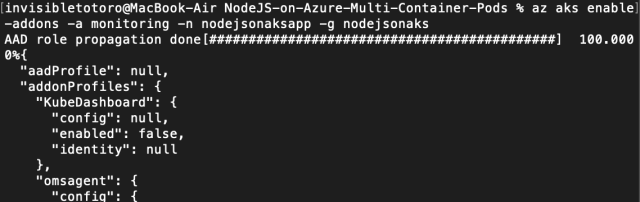
After this command completes, you can access insights through the Azure Portal by selecting the AKS cluster and then navigating to the Insights page. Azure Monitor provides crucial information about the workload of the cluster, node, and containers, such as CPU use and memory use.
These metrics help you determine whether you need to add more capacity to handle user demand on your services or that you don’t need as many nodes and can scale your resources down to save money.

Prometheus Metrics
If you use or are familiar with Prometheus for application metrics, you may be delighted to know that Azure Monitoring can be configured to collect Prometheus metrics seamlessly without the need to set up and manage a Prometheus server.
Live Data
Container insights include a Live Data feature for your Azure Kubernetes Service container logs, events, and pod metrics. If issues arise in your deployed application, you can save time and confusion with this ability to sift through and debug cloud issues directly in real-time. Refer to Microsoft’s guide to set up the Live Data feature.
Metric and Health Alerts
Application performance and health can degrade at unexpected times, so configure metric and health alerts in Azure so you can worry less. Alerts notify you when an issue may be developing in your cloud systems, saving you from constantly watching the statistics.
It is as simple as going to the Azure portal and clicking Alerts then pressing New alert rule. Alternatively, you can use Azure Resource Manager templates or create them through the Azure CLI or a REST API.
Metrics Chart
Another useful monitoring feature on Azure Monitor is the metrics chart. Azure Metrics Explorer enables you to effectively investigate and better understand the performance of a running application with visual charts and trends. Dive deep to create your first chart using this guide on Azure Monitor metrics charts and check out some of the advanced features of Azure Metrics Explorer.
Application Insights Node.js SDK
When you need deeper and richer log data from your application, instrument your code using the Application Insights Node.js SDK. This SDK automatically monitors different aspects of your application, such as HTTP requests, exceptions, and even common third-party packages such as MongoDB, MySQL, and Redis, while giving you the option to manually configure other metrics for your app.
Let’s go through a basic setup of Application Insights on our project code and see how to enable better monitoring in only a couple of steps.
To get started, create an Application Insights resource in the Azure Portal, then create a new app. The resource group you select does not need to be the same as your AKS cluster if you wish to manage the group separately.
Once this is created, open the resource and copy the Instrumentation Key. This is the API key that connects your application to Azure for logging.
In your Node.js application, add the applicationinsights npm package:
npm install applicationinsights
Import the module and set up Application Insights in the project code, such as the main web server’s index.ts file, using the Instrumentation Key you copied. For demonstration purposes, this key is directly passed into the setup function, but it is generally better practice to provide it securely through an environment variable.
import * as appInsights from "applicationinsights";
const appInsightsKey = "APP INSIGHTS KEY";
appInsights.setup( appInsightsKey );
appInsights.start();
And that’s it! Ensure your application is running, and in a few moments, the Application Insights dashboard starts reporting data.
To learn more about using the Application Insights Node.js SDK, with detailed configuration options, extended metrics, and custom events and metrics using the TelemetryClient API, refer to Microsoft’s documentation.
Scaling Clusters
As your application’s demand increases and decreases over time, you can manually or automatically scale AKS clusters on Azure. This horizontally scales your application capacity by adding or removing the instances running your microservices.
Let’s explore both options.
Manual Scaling
To scale a cluster manually, first, you need to get the name of the node pool. Use the Azure CLI with the following command:
az aks show -n [CLUSTER-NAME] -g [RESOURCE-NAME] --query agentPoolProfiles
For example:
az aks show -n nodejsonaksapp -g nodejsonaks --query agentPoolProfiles
In this example, the node name is nodepool1.
Then, you can scale to the number of nodes you need with the scale command:
az aks scale -n [CLUSTER-NAME] -g [RESOURCE-NAME] --node-count [COUNT] --nodepool-name [NODE-NAME]
For example:
az aks scale -n nodejsonaksapp -g nodejsonaks --node-count 2 --nodepool-name nodepool1
After the command completes, your AKS cluster runs across the new number of pool nodes.
Autoscaling
Autoscaling enables you to set a minimum and a maximum number of nodes that Azure can instantiate to automatically meet demand.
You can update a cluster to enable the cluster autoscaler using the Azure CLI.
To update the settings, run:
az aks update -n [CLUSTER-NAME] -g [RESOURCE-NAME] --enable-cluster-autoscaler --min-count [MIN-COUNT] --max-count [MAX-COUNT]
For example:
az aks update -n nodejsonaksapp -g nodejsonaks --enable-cluster-autoscaler --min-count 1 --max-count 3
Azure AKS supports numerous configuration settings to manage your cluster. To dive deeper into autoscaling your AKS clusters, read Microsoft's documentation, or learn how to autoscale on performance and schedule.
Next Steps
In this part of the advanced Cloud Native series, you learned how to enable monitoring and how to manually and automatically scale a Node.js application running on Azure.
Next, we’ll use Azure Active Directory to easily and securely add a login button to our application, without handling storing and managing user account data ourselves. Read on and don’t miss out as there’s more exciting code ahead.
Raphael Mun is a tech entrepreneur and educator who has been developing software professionally for over 20 years. He currently runs Lemmino, Inc and teaches and entertains through his Instafluff livestreams on Twitch building open source projects with his community.


