Introduction
For those of us who still use COM and ATL, interoperating with .NET-centric APIs can become an exercise in futility. Take, for example, a Visual Studio add-in. The Visual Studio Extensibility (VSX) APIs expose COM interfaces, yet all documentation and samples are written with only the .NET developer in mind. A COM or ATL programmer who visits MSDN in search of return codes for functions such as OnConnection, QueryStatus, and Exec might be surprised to learn there is no COM documentation and there are no non-managed C++ examples. This could be a .NET conspiracy.
The latest trend in Redmond is to have a team blog about their technology, and then provide a Forum (on social.microsoft.com) for questions and answers. Apparently, usenet was not working out well. For Visual Studio add-ins, we visit the VSX Team Blog and read information formerly available in MSDN. We familiarize ourselves with selected blog entries (noting that searching the VSX blog always seems to return 0 results), and come across Craig Skibo's recommendation to visit the VSX Forum. Craig politely tells us that he does not have time to answer questions on his blog, so the forum is the place to ask questions.
Now, we're on to something - a place to ask questions that will be answered by the experts. Our question is basic: what do we return when Visual Studio calls us with a command that we are not prepared to handle? Do we return E_INVALIDARG (and risk being unloaded), S_FALSE, or S_OK (and silently swallow the blunder). So, we pose our question on the VSX forum: Addin: QueryStatus and Exec Methods (C++/ATL). Unfortunately, we receive no answers. It appears that we are shunned by our VB and C# colleagues. This is clearly a .NET conspiracy.
But all is not lost...
Background Information
Some of the most complete and easy to understand information provided for add-ins is courtesy of Microsoft MVP Carlos J. Quintero. Mr. Quintero provides extensive resources relating to Visual Studio add-ins. Visit his Resources about Visual Studio .NET extensibility page.
There are two excellent debugging references which I consistently use. For developing, it is the Visual Studio debugger and John Robbin's Debugging Microsoft .NET 2.0 Applications. For heavy lifting, I use WinDbg and Advanced Windows Debugging by Hewardt and Pravat.
WinDbg is a free download from Microsoft available with the Debugging Tools for Windows. There are a couple of reasons to use WinDbg over other debuggers. The reasons have nothing to do with their quality. OllyDebug is a great debugger. However, OllyDbg was not written by the Operating System team at Microsoft - WinDbg is. Second, when Microsoft changes the PDB format (which could happen at the next release of Visual Studio or the Operating System), WinDbg will ship with the functionality on day 0. The folks who maintain other debuggers may not have the information, so an incompatibility may exist for a while. Finally, questions on WinDbg are answered in microsoft.public.windbg. The group is patrolled by the folks who work on the debugger.
Some assembly is required. For those of us who believe the knowledge of assembly language is still useful, a good command reference is a must. The assembly language references I use are Microsoft MASM's Assembly Language Development System and Borland's Turbo Assembler Reference Manual. Both have so many notes penciled in that I would be taking a step back by using Intel's Architecture Software Developer's Manual, Volume 2: Instruction Set Reference Manual.
Creating a C++/ATL Visual Studio Add-in
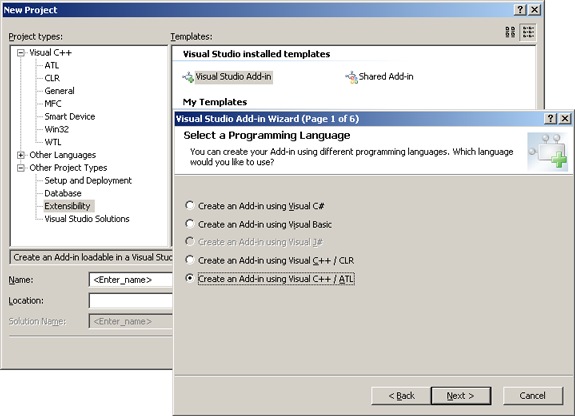
Throughout this article, I will be using an add-in for Crypto++ named CryptoPPAddin (it is a real add-in). Crypto++ is a free, open source, cryptographic library written and maintained by Wei Dai. If you don't have any add-in code handy, create an add-in as follows. Figure 1 shows where to find the Visual Studio Add-in project wizard.
|
Figure 1: Visual Studio Add-In Wizard
|
In Figure 2, we choose to uncheck all options at step four. This causes the wizard to emit code for a temporary add-in. For a discussion of temporary versus permanent add-ins, see Quintero's HOWTO: Adding buttons, commandbars, and toolbars to Visual Studio .NET from an add-in. For the remainder of the wizard, default values are acceptable.

|
Figure 2: Temporary Visual Studio Add-In
|
Compiling the Add-in
If all goes well, we will cleanly compile the add-in and then press F5 to run it. The output of the compilation and linkage is a DLL; and the executable used to debug it is Visual Studio itself. So, if prompted for an executable, select devenv.exe. Figure 3 shows the add-in for Crypto++.
|
Figure 3: Crypto++ Add-in
|
Once the add-in is run from the debugger, the add-in is registered and we can proceed to the next step using WinDbg. Note that we ran the add-in from the \Debug directory. There is no need to move the DLL to a special location. In fact, moving the file may cause problems when WinDbg attempts to locate symbols for the module.
Symbols
As Hewardt and Pravat state in Advanced Windows Debugging, "Debugging an application break without symbols is difficult." If you have not already done so, set your _NT_SYMBOL_PATH environmental variable. My path uses a local folder for caching (D:\Symbols), and Microsoft's symbol server to retrieve PDB files for the Operating System and Visual Studio.
SRV*D:\Symbols*http://msdl.microsoft.com/download/symbols
Note that if you just added the environmental variable, fetching all files for this exercise will take quite some time. After the initial fetch, the debugger will use the local copy of the files and the process will be nearly transparent.
Debugging the Add-in Using WinDbg
Recall that the question to be answered was, What should we return in functions such as QueryStatus when we are not equipped to service the call? To answer the question, open WinDbg. From the File menu, select Open Executable and navigate to devenv.exe. There is no need to specify additional arguments for WinDbg.
|
Figure 4: Debugging the Debugger
|
After WinDbg loads devenv and outputs the initial debug spew, the target will be stopped. We then type g to continue execution. In Figure 5 below, we see the add-in (CryptoPPAddin) was loaded at address 0x1000000. We also see the output of debug information from ATLTRACE statements such as OnConnection.
|
Figure 5: Visual Studio and Add-In Load
|
Next, we need to set a breakpoint to begin tracing QueryStatus. First, we clear the debug spew with the .cls command. We then break into WinDbg by pressing CTRL-Break. In Figure 6 below, we see that we are stopped in ntdll at the DbgBreakPoint function. The debugger displays relevant information such as register values and the Process ID/Thread ID pair (954:9dc). The prompt, 0:002> states that the break was handled by the first processor (this machine has dual Pentium IIIs) and that the second thread (002) in the process is stopped. This tells us the second thread was the current thread executing in the process when the process was stopped.
|
Figure 6: WinDbg Break
|
Next, we need to find the function of interest so we can set a breakpoint. We are really interested in what the caller is doing with our return value, but we don't know the calling function yet. So, we want to break at QueryStatus. There are a few ways to find QueryStatus.
Before we can set a breakpoint, we need to know a few things when working with symbols. First, the WinDbg command interpreter accepts wildcards. Second, x is used to examine symbols. Third, ! is used to scope names to a module (similar to C++'s '::' operator). x *!* would return all symbols in every module (which would probably be a bad idea). First, we enter the command x *!*QueryStaus*. The output (the 'phonebook') is shown in Figure 7.
|
Figure 7: Symbols Matching QueryStatus
|
In Figure 8, we refine the search using x /v CryptoPPAddin!*QueryStatus*. The /v switch gives us the verbose output from the examine symbol command. Below, we see that two symbols match: a public symbol and a private symbol.
|
Figure 8: CryptoPPAddin Symbols Matching QueryStatus
|
Now, we set the breakpoint on the function. The command for a breakpoint is bp, so we issue bp CryptoPPAddIn!CConnect::QueryStatus. For the less initiated, the command window allows us to copy and paste. Fetch the full name from the upper area of the command window, and press CTRL-C to copy to the clipboard, and then CTRL-V to perform the paste. After the exercise in copy and paste, we us bl to list the breakpoints in the process.
|
Figure 9: Breakpoint on QueryStatus
|
We then enter g to let Visual Studio run. To tickle the breakpoint, navigate to the Tools menu. There is no need to click the add-in - Visual Studio will query its status to determine how to paint the command's button on the Tools menu. In Figure 10, we issued a .cls to clear the screen after the break. If our attention span is too short, we can use .lastevent to explain why we are stopped in the debugger. Recall that the reason we want to stop at QueryStatus is to determine the caller in devenv.exe. Now, we issue k - stack trace.
|
Figure 10: Stack Trace to Determine Caller
|
In Figure 10, we see that AddinPerformQueryStatus is the caller. Since we are interested in how the function handles our return values (HRESULTs), AddinPerformQueryStatus is our next target. Note that the address we are interested in is the RetAddr listed on our function, not the RetAddr of AddinPerformQueryStatus.
As a matter of convenience, we first clear our old breakpoint with bc. We then issue bp 5034e125. 5034e125 is AddinPerformQueryStatus+0x144 - WinDbg does the math for us. Note that we do not want to break at AddinPerformQueryStatus since it is the start of the function. We want to break on return from our call, and our function was called just before AddinPerformQueryStatus+0x144.
|
Figure 11: AddinPerformQueryStatus Breakpoint
|
Next, we continue executing the target until the breakpoint is encountered. Since the screen was cleared, I issue a .lastevent to see why the program stopped; and then r to display the registers. Observing that I am at my breakpoint, I want to disassemble the code to see what Visual Studio is doing. If we had access to line information and source files, WinDbg would step us through the source just like Visual Studio. But, since we only have public symbols, we have to rough it. To disassemble the sequence, we use the unassemble command: u.
|
Figure 12: AddinPerformQueryStatus Breakpoint
|
After disassembling, we see that Visual Studio begins cleaning up at e125 (address 5034e125) from the call to the add-in DLL. Our HRESULT is on the stack, and not being used just yet. This code would be of little interest to us except for the value 80040104 being saved at instruction e12f. Error Lookup does not have an entry for 80040104, winerror.h does not define it, and searching the web offers very little. More on 80040104 later.
Next, we begin single stepping the code using the p command. At e0e7 (5034e0e7), we see that a Structured Exception Handler is torn down; and then a return is executed. This is a good indication that we are getting closer to the area of interest - Visual Studio wrapped its call into our add-in with an exception handler. Figure 13 shows our state.
|
Figure 13: Single Stepping Code
|
One more single step (p) lands us in CVSCommandTarget::QueryStatusCmd. We are getting closer, but we are not there yet - we are observing a VxDTE::Commands object destructor followed by a SysFreeString. We single step a bit further until we reach 50077e11. We then unassemble (u) as shown in Figure 14.
|
Figure 14: QueryStatus HRESULT Validation
|
When we reach 77e11, we have our answer. 0x80040100 is DRAGDROP_E_NOTREGISTERED, and most likely indicates there is a problem with the control (I believe the operative here is the 'E_NOTREGISTERED'). 80040104 is between DRAGDROP_E_FIRST and DRAGDROP_E_LAST, but I do not believe it is necessarily a drag/drop error code. This is the FACILITY_IFT (4) code reserved for private use.
In Figure 14, code lines 77e17, 77e23, and 77e31 each use the same jump target: 500197ef. Two of the lines perform a compare against error codes, while the last (77e31) performs an unconditional jump. This leads to the following C/C++ translation:
switch( EDI )
{
case E_NOTREGISTERED:
goto BadReturn;
case 80040104:
goto BadReturn;
case S_OK:
goto GoodReturn;
default:
goto BadReturn;
}
If we follow the S_OK code path, we see that we eventually land in CVSShellMenu::IsCommandVisible. At this point, it appears that the COM lower end stuff is complete. In Figure 15, we observe the testing of the value returned through QueryStatus' vsCommandStatus parameter.
|
Figure 15: Checking of QueryStatus, vsCommandStatus Parameter
|
Conclusions
Though thoroughly undocumented, it is possible for the C++ or ATL purist to use the newer Microsoft APIs. However, we must be aware of the effects of returning S_OK, S_FALSE (which is still considered success since S_FALSE = 1), and other COM errors. When in doubt, take one for the team and return S_OK.
This member has not yet provided a Biography. Assume it's interesting and varied, and probably something to do with programming.


