Getting Started
Upon starting ANTS Performance Profiler we are presented with a choice of application type to profile.
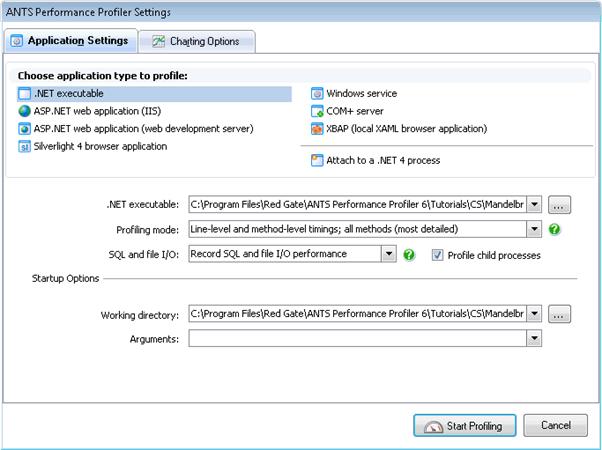
Figure 1: Selecting an application
ANTS Performance Profiler can be used to analyze the performance of desktop applications, Silverlight 4, ASP.NET, Windows Services, COM+ Server, SharePoint, WPF, and XBAP files, and works with all languages supported by the .NET Framework.
After choosing the application, you’re ready to go. ANTS Performance Profiler automatically loads the program and begins profiling. It can also attach to any running .NET 4 process without having to restart that application – great if there’s an intermittent performance problem which is hard to reproduce, or if you need to analyze a live service like an ASP.NET website without having to stop and restart it.
Working with the Profiler
While your application is running, a timeline is continually updated showing the monitored performance metrics.

Figure 2: The graphical timeline
You can interact with the timeline, even while ANTS Performance Profiler is still profiling. By selecting any region, only data from that time-period is analyzed, preventing you from being swamped with information. So for example, the red line in the image below represents the CPU usage, and the peak region can be selected for more detailed analysis. You can even name the selected region to return to it later.
Figure 3: Selecting and naming a region
Understanding the Performance Issue
Once a region of the timeline has been selected, ANTS Performance Profiler automatically expands the most expensive stack traces so you can see the methods with the highest time with children or greatest hit count. From here you can drill down to the most likely cause of code bottlenecks.
Figure 4: The call tree view showing the hottest path
Alternatively, the methods grid presents a searchable list of all methods which were called within the given time period, and can be sorted by time with children, hit count, or by name.
Figure 5: The methods grid view
Selecting any of these methods jumps straight to the source code view, where line level timings allow easy identification of slow lines of code. A clickable heat map highlights these to making navigation simple.
Figure 6: Line level timings in the source code view
For any of the methods for which code is available, ANTS Performance Profiler can generate a call graph to visualize the callers for a selected method. These expandable graphs can be exported to enable simplified documentation and sharing as part of a development team.
Figure 7: The call graph view
Profiling SQL and File I/O Activity
When trying to understand an application’s performance, it is important to have as much information as possible. ANTS Performance Profiler is the only code profiler to also profile SQL and File I/O performance, giving a much more complete picture on why code might not be performing as expected.
SQL activity is displayed on the interactive timeline, just like performance metrics. For any selected region, a list of run queries is presented. More importantly, by allowing you to see the complete stack trace at the precise time of a misbehaving database request, it is possible to understand the interaction between your .NET code and SQL Server in a way which isn’t possible using SQL Server Management Studio.
Figure 8: Profiling SQL activity
What’s Next?
Once you’ve finished profiling you can save your entire session, enabling you to share results with you team, present data in meetings, or simply return to your work later.
ANTS Performance Profiler is the simplest, most effective way to find and resolve performance issues in .NET code. To see how much faster your application could run, download a free 14-day trial of ANTS Performance Profiler today.


 General
  News
News  Suggestion
  Question
  Bug
Bug  Answer
  Joke
Joke  Praise
  Rant
Rant  Admin
Admin 


