Introduction
I enjoy working with longitudinal data. That is dynamic; depicting change rather than just static cross-sectional difference. But there are always problems with bounds, noise, interpolation, continuity, and visualization. These seem to be where Bezier curves excel. Bezier curve trajectories stay in bounds, between the data points in a sorted time-series. They also pass through the first and the last data points. Between those end points, the curves are continuous and can be differentiated as well as evaluated at any intermediate point. Thus, Bezier curves smooth large data point fluctuations and improve the visibility of the patterns unfolding.
Background
Bezier curves are used widely for diverse purposes. I refer to the interested reader to the Wikipedia page, an eBook “bible/primer” on the subject by Mike Kamermans (Pomax at GitHub), and to a fast code solution by Paul Bourke, which I have adapted for C# and found very useful.
Data Characteristics
This first article in a data visualization series is about modelling data with Bezier curves. We will look at curve-fitting, time-domain point evaluation and plotting, and differentiation. It should emphasized that here we are discussing longitudinal data that moves from a starting point (along a Time or X axis) to an ending point, without loops, cusps, or backtracks. As examples, we will use student academic performance over time from grades 6 through 12. Once we have a set of Bezier curve trajectories for all student cases in a data set, in future articles, we will take a look at building machine learning classification models and using those to recognize various patterns, such as trajectories that identify students who are appear to be doing well or likely to be at-risk.
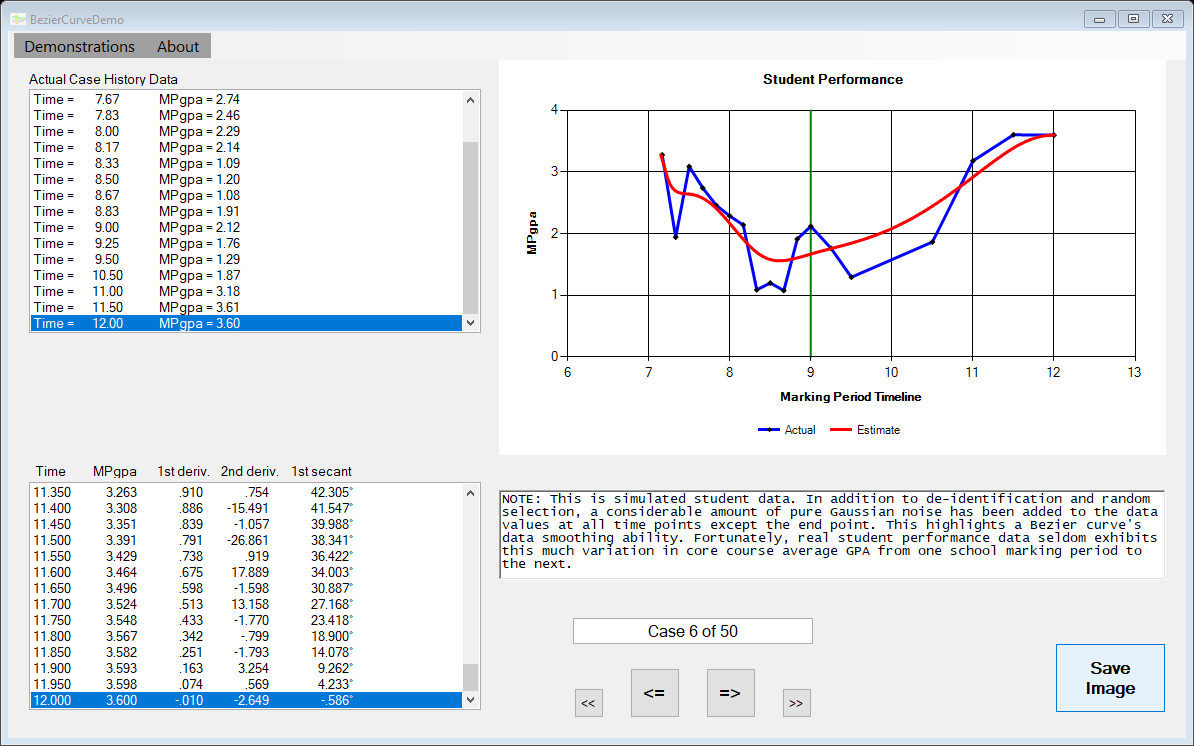
We will use a small sample (N=50) of school marking period grade point average (MPgpa) student performance histories in core coursework (averaged over Math, Science, Language Arts, and Social Studies content areas) from starting time points of entry into middle school through high school graduation or otherwise ending time points due to transfer or attrition. MPgpas are bounded from 0.00 to 4.00. This is a simulated sample drawn from a MonteCarlo version of a large multi-state, multi-school district, thoroughly de-identified research database. The data represents various school marking period policies (4 or 6 marking periods per academic year, quarters, semesters, trimesters, etc.). A considerable amount of random Gaussian noise has been injected into this data, making it somewhat unrealistic (fortunately, real school performance data typically does not fluctuate this much) but also illustrating the data smoothing capability of Bezier curves.
Using the Code
In this BezierCurveDemo project written in C# using Visual Studio 2017 and .NET 4.7, we first define a DataPoint tuple (time, MPgpa) type in a DataPoint class. Student histories are defined as List<DataPoint> types and for this example are hard-coded, first as strings, then converted into a List<List<DataPoint> StudentHistories in a DataList class for ready access. A dictionary could have been used as easily. Another useful object is a List<double> Xframe, which for our purposes here will contain 141 equally spaced time points between 6.0 and 13.0 inclusive, e.g., from an initial point of 6th grade entry through the final point of high school for graduation. This will become the X-axis timeframe for visualizations.
Download the project, open the solution file in Visual Studio, and click Start to build and run the application. The solution requires 3 packages (MSTest.TestAdapter.1.2.1, MSTest.TestFramework.1.2.1, and System.ValueTuple.4.3.1) which should download and restore automatically.
A WinForm should open with two listboxes, a chart, and a few buttons. The top-left listbox shows a student’s actual performance history in tabular format. The bottom-left listbox shows a series of Bezier curve values at timeline point intervals, as well as the 1st and 2nd derivatives of the curve at those intervals. The chart on the right displays both the actual and the smooth Bezier curve trajectories for that student in core courses throughout the middle and high school curriculum timeframe. Other controls on the form allow forward or backward movement through the data set, saving the form image, and closing the application.
Points of Interest
The application provides a Demonstration menu with two options: one charts the actual history data and the Bezier curve model of that history for a list of individual cases that the user can step through. The other illustrates a “Spaghetti Plot” visualization of the entire set of cases modeled by Bezier curves and “classified” by a simple linear Classifier method.
Several features of the demonstration code are worth notes. First, for more general usability, the DataPoint tuple is (X, Y) rather than (time, MPgpa) and so are methods that involve lists of such tuples. Second, in the Bezier.cs module, there are two classes that can be used for similar purposes. One of these, the BezierFit class, consists of individual useful static methods, handy for quick processing of large List<List<DataPoint>> collections.
The second class, Bezier, defines a Bezier curve object with properties and methods. The demo mostly uses this class. Both classes rely upon an external Xframe array of equally spaced X axis or time values. This is useful for visualizations and aggregations. There is an Xframe(start, end, NofPoints) method that returns a list of doubles for a horizontal frame and various methods to return a similar list of Y-axis Bezier curve values. There is also a handy XPointIndex(X, Xframe) method that returns the index of the closest value in the Xframe array to a given X-axis value.
When using longitudinal Bezier curves, there is one serious issue to consider. A curve (no loops, cusps, or backtracks) is defined by a bounded set of points and passes through known, given start and end points. The curve values in-between are the smoothed trajectory estimates. The function used in the demo: XYBezierOrig(Mu), where Mu is the relative distance (from 0.0 to 1.0) along the curve from the start point; is very fast. However, Bezier curves are typically ... well … “curvy” and so the path distance is longer than the linear distance along the X or time axis. According to the primer on Bezier curves referenced above, there is no formal solution for mapping Mu values to X values. Instead, numerical methods are needed.
The demo includes a MuForX method which employs a bi-sectional approximation, guaranteed to converge ... but somewhat slow in execution. A demo method, XYBezier(X) calls this MuForX(X) method first to obtain an estimate of Mu. It then calls XYBezierOrig(Mu) to obtain the value of the curve at the point X on the X-axis. This is no problem for the demo, but it can slow down analyses that aggregate 100s or 1000s of Bezier curves. In future parts of this series, when we use trained machine learning models to classify Bezier curves (and aggregate results), the use of parallel concurrent methods can greatly speed up analytics.
This demo includes a custom function for computing the 1st and 2nd derivatives for points along a Bezier curve using finite-difference methods. It also contains a number of “Unit Tests” for various Bezier methods.
Conclusion
The principal conclusion that I hope can be drawn from this demonstration is that Bezier curves are very useful models for noisy longitudinal data collected at varying time or X-axis points. These curves allow for reasonable cross-sectional and/or cohort comparisons at points of particular interest within a frame, such as market cycles or grading periods or other points where otherwise large chucks of data may contain missing values.
A second inference is that if models are good, then inferences about such models may be good as well. This demonstration illustrates many different student performance trajectories through their respective public school curricula. It is reasonable to ask if these are indicators of relative success, at the ends points or at “current” or intermediate points of interest, such as the transition point at 9.0 from 8th grade middle school into 9th grade and high school.
One might think it feasible simply to look at the actual or the curved data to make decisions about whether or not particular students may be “at-risk” (and may benefit from additional support services). However, suppose you need to make similar decisions about 100s or 1000s of students in real time as each individual progresses through his or her curriculum. School counselors do that sort of thing every day, mostly without the availability or the use of such data. A machine learning model that could classify performance trajectories in various ways would surely be a beneficial tool for data-driven decision-making. That perhaps is a topic for future articles in this series.
Beyond that, this project presents a variety of useful techniques and methods for working with Bezier curves that can be adapted for other similar projects.
History
- 6th August, 2018: Version 1.0
- 7th August, 2018: Version 1.1, added image and code link
- 9th August, 2018: Version 1.2, small code improvements


 General
  News
News  Suggestion
  Question
  Bug
Bug  Answer
  Joke
Joke  Praise
  Rant
Rant  Admin
Admin 


