Introduction
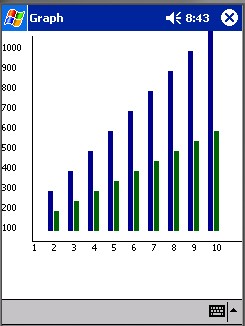
I recently had to generate a bar chart for a Pocket PC application. There are a lot of materials on the web on this issue, articles, freeware, etc., but I couldn't find anything that worked for a compact framework.
Some times as a developer I think why take so much time to solve something that some body has already done? Well this time it wasn't the case so, I decided to work around the problem myself.
Using the code
The application posted in this article contains a compact Windows Forms project written in C# with a single form with no controls. It takes in the Load event of the PocketBarGraph component and fills it with dummy data as you can see below. The rest is done through the component and the Paint event of that form. The trick here is to send the System.Windows.Forms.PaintEventArgs of the argument of the form's Paint event to the graphMotor:
private GraphMotor graph;
private void Data_Load(object sender, System.EventArgs e)
{
graph = new GraphMotor();
graph.Graphs.Add(new ListData());
graph.Graphs.Add(new ListData());
graph.Graphs[0].DisplayColor = Color.DarkBlue;
graph.Graphs[1].DisplayColor = Color.DarkGreen;
PocketGraphBar.GraphPoint p;
for(int i = 1; i < 11; i++)
{
p = new PocketGraphBar.GraphPoint();
p.X = Convert.ToDecimal(i);
p.Y = Convert.ToDecimal(i * 100);
graph.Graphs[0].Add(p);
p = new PocketGraphBar.GraphPoint();
p.X = Convert.ToDecimal(i);
p.Y = Convert.ToDecimal(i * 50);
graph.Graphs[1].Add(p);
}
}
private void Data_Paint(object sender,
System.Windows.Forms.PaintEventArgs e)
{
try
{
graph.LeftMargin = 20;
graph.LegendFont = new System.Drawing.Font("Arial",
8.25F, System.Drawing.FontStyle.Regular);
graph.AxisColor = Color.Black;
graph.MaxHeight = 200;
graph.Thick = 6;
graph.DisplayTimes = 10;
graph.DrawGraphs(e);
}
catch(Exception ee)
{
MessageBox.Show(ee.ToString());
}
}
Talking about the component, we have three classes:
GraphMotor: Is the controller class that resolves all the logic. ListGraphs: Is a collection of a series of data we want to graph. It means we can have a composite bar chart. ListData: Is a collection of the data we want to graph. GraphPoint: A single key pair value, X and Y where Y depends on the value of X.
The namespace of these classes is PocketGraphBar.
Points of interest
- I have used the
decimal type in GraphPoint in order to put any kind of value using a simple cast or Convert. - The height of each bar is determined by value / maxValue * maxLength so don't worry if you need to graph values of N digits, scaling will be done.
- It is possible to put any number of series of data with N key pair values since
ListData and ListGraphs classes implement System.Collections.ICollection. - It should work fine for common Windows Forms applications.
Just remember the look and feel depends on the logic of the data you enter, this was designed for smart devices applications so don't expect too much. Bar charts consist of collections of X and Y values where X is continuous (1,2,3,4... or 2005, 2010, 2015...).
I think this would work as the basis to deliver more kinds of charts (pie, linear, area) but this work was done in just one afternoon.
Pablo studied Information System Engineering and graduated on may 2001 although he always had the idea of becoming a writer, idea that has not escaped from sight. At the present he works as a software developer leader in a Insurance Company in the team of Systems for Sale Force developing tools for policy selling. He has experience with Dot Net since May 2002 and has reached the third Start recognition from MSDN Latin America. He has knowledge in Compact Framework, Windows Forms and Asp Net. Pablo looks forward that his contributions in this forums help the comunity at the Code Project.


 General
  News
News  Suggestion
  Question
  Bug
Bug  Answer
  Joke
Joke  Praise
  Rant
Rant  Admin
Admin 


