Intel® Developer Zone offers tools and how-to information for cross-platform app development, platform and technology information, code samples, and peer expertise to help developers innovate and succeed. Join our communities for Android, Internet of Things, Intel® RealSense™ Technology and Windows to download tools, access dev kits, share ideas with like-minded developers, and participate in hackathon’s, contests, roadshows, and local events.
Contents
Go Back to Part 2 of the Tutorial:
Unity* Optimization Guide Intel x86 Platforms: Part 2
Editor Optimizations
Occlusion Culling
Occlusion culling is a feature available in Unity that enables you to cull out objects that are occluded by other objects with respect to the camera. Let’s use a fantasy MMORPG as a simple example. If the player were to walk up to a giant castle containing a sprawling city, would you really want to spend system resources to render all of the occluded shops / players within the city walls? Didn’t think so. Occlusion culling is the answer (Figure 21).
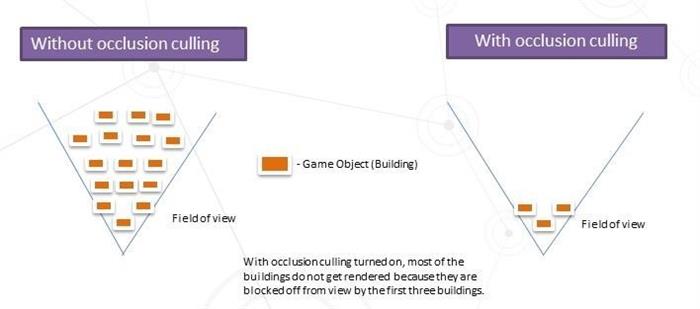
Figure 24 Occlusions explained
Occlusion culling alleviates GPU processing (and maybe CPU if the occlusion culling calculation takes less time than the driver calls saved) by sending less draw calls overall. To set occlusion culling, it helps to know some of the vocabulary Unity uses as it will help you set up your scene to do the culling.
- Occluder – Any object that acts as a barrier and prevents visibly blocked objects (occludees) from being rendered.
- Occludees – Any object that will not be rendered to the screen because it is blocked by an occluder.
Most objects that you come across will have the potential to be included as both an occludee and an occluder depending on the camera orientation and game boundaries. It’s recommended to go through your entire scene to multi-select any objects that should be included in occlusion culling calculations and mark them as "Occluder Static" and "Occludee Static".

Figure 25. How to set occluder and occludee in Inspector
The last step required to complete the process of adding occlusion culling is to bake the scene.
This can be done by opening the Occlusion Culling Window located by selecting Window>Occlusion Culling. You will see a window like the one shown in Figure 20 with different baking techniques that range from higher performance / lower accuracy to lower performance / higher accuracy. You should use the "minimum effective dose" technique for your app.
Figure 26. The Occlusion window and Bake button
When setting up your occlusion culling system, set your occlusion areas carefully. By default, Unity uses the entire scene as the occlusion area, which can lead to frivolous computation. To make sure that the entire scene isn’t used, create an occlusion area manually and surround only the area to be included in the calculation.
Unity allows you to visualize each part of the occlusion culling system. To view your camera volumes, visibility lines, and portals, simply open the occlusion culling window (Window > Occlusion Culling) and click on the Visualization tab. You will now be able to visualize all of these components in the scene view.
Figure 27. Occlusion Culling visualization in the scene view
For more info: http://docs.unity3d.com/Manual/class-OcclusionArea.html
LOD: Level of Detail
The level of detail (LOD) component allows game objects to switch out meshes at varying levels of detail depending on the object’s distance from the camera. Using this LOD feature can dramatically reduce memory requirements for a frame with very little impact on visual fidelity. Adjusting LOD alleviates the input assembler and the vertex shader by supplying less geometry on lower LOD levels.
You can verify that the LOD feature is actually being used by checking the Unity profiler. To do this, open up the ‘CPU usage’ profiler and navigate down to Camera.Render > Drawing > Culling and check to see if "LOD.ComputeLOD" is displayed.
Figure 28. Verifying LOD usage in the Unity Profiler
You can also verify that the correct model is being used by taking a frame capture using GPA, selecting the model’s corresponding draw call, and then clicking the Geometry tab. This will give you a visual representation of the actual model’s geometry submitted along with other useful stats, such as the vertex count. You can verify that the vertex count matches the desired model to be used at the camera distance of the capture.
Level of Detail is normally vertex bound. Bottlenecks can occur from too much computation per vertex. Using the mobile version of Unity shaders can help alleviate significant computations per vertex. When objects are small or far away, limit the vertex count in the LODGroup when those details are not needed.
Figure 29. To add an LOD component to a game object click Component->Rendering->LOD Group
Figure 30. Adjusting in the LOD Group
Figure 31. High Quality
Figure 32. Low Quality
Shadows
Shadows can be a very significant GPU performance hog. To view just how many system resources your shadows are using, check out the Profiler > GPU > Shadows section. There are various optimizations you can do to maximize shadow performance depending on the layout of your scene. For instance, if most of the scene shadows are caused by a directional light, it can significantly help to reduce the Shadow Distance setting in Project Settings > Quality. Shadow distance is most closely associated with fragment shader performance. In a GPA frame capture you can view the fragment shader execution unit stall / active and sampler read / write metrics when selecting a draw call that samples from the shadow map. The shadow distance value can also be set in code on the fly. For point lights, adjusting the shadow resolution helps alleviate memory bandwidth bottlenecks as this can be very costly on mobile.
Here is a brief overview of each of the shadow options available under Project Settings > Quality (for more information check out the Unity Quality Settings guide):
- Shadow Filtering – Method used to filter shadows
- Hard - When sampling from the shadow map, Unity takes the nearest shadow map pixel
- Soft – Averages several shadow map pixels to create smoother shadows. This options is more expensive, but creates a more natural looking shadow
- Shadow Resolution – Resolution of the generated shadow map
- Can significantly affect performance if using many point / spot lights
- Shadow Projection – Method used to project shadows
- Stable – Renders lower resolution shadows that do not cause wobbling if the camera moves
- Close Fit – Renders higher resolution shadow maps that can wobble slightly if the camera moves
- Shadow Cascades – The number of parallel splits used in cascades shadow maps (cascades closer to the viewer have higher resolution for improved quality)
- Can significantly impact directional light performance
Figure 33. Zero Shadow Cascades Enabled
Figure 34. Four Shadow Cascades Enabled
- Shadow Distance – Max distance from object that shadows can project
- Can significantly affect fragment shader performance if using directional light
- Can be changed on the fly via script
Performance results will vary as the GPU usage is dependent on the scene and how many objects are casting/receiving shadows. As always, it is important to use the lowest quality settings required to achieve the desired look. It is generally recommended to change the default shadow distance to a lower value.
Figure 35. FPS based on shadow distance within Unity Bootcamp demo.
You can view the shadow map generated by Unity by taking a frame capture of the scene and then viewing it in the GPA Frame Analyzer. Go to the final render target and navigate to the Textures tab to view the shadow map.
Figure 36. Generated cascaded shadow map as seen in GPA Frame Analyzer
Stick with One Camera
Sometimes it can make sense to use multiple cameras to achieve a certain effect. For example, if you wanted to create a parallax effect, one way that one may go about doing that is by using multiple cameras which move at different rates. What you may not realize is that each camera is associated with a separate set of clear calls to the graphics API and a new render target. In a frame capture from a simple scene that uses 3 cameras and a UI camera (the canvas object requires a separate camera), the clears alone took up 5.4% of the scene.
Figure 37. The draw call timeline associated with a scene with 4 total cameras. Color / depth / stencil clears circled in red.
Render Queue Ordering
There is a concept in graphics programming called overdraw that refers to a pixel being unnecessarily overdrawn multiple times, thereby wasting graphics resources. Unity offers a way to define the order in which to render different models called the Render Queue property. The RenderQueue property is a numerical value that can be set through a MeshRenderer’s Material.
To see why this can be very beneficial, picture a floor with a bunch of objects on it. Let’s say the ground is rendered first, touching every pixel on half the screen. Next, all of the objects are rendered on top of that ground. This is a lot of unnecessary work. In this example, any pixel that is touched by an object is being drawn twice.
Figure 38. A Normal scene with a switchable render queue ordering method (default or smart).
Figure 39. Overdraw visualization of the same scene with the default render queue ordering mode using GPA System Analyzer. Grey areas indicate overdraw. Notice that the floor in the previously shown screenshot is drawn before the floating green quad.
Figure 40. Overdraw visualization of the same scene with the smart render queue ordering mode using GPA System Analyzer. Grey areas indicate overdraw. Notice that the only overdrawn section is the floating green quad that extends beyond the floor quad. With some care you can save a lot of pixel computation by manually ordering problem draw calls.
Lightmapping
Lightmapping is the concept of first baking all scene lights into a light map (a texture with pre-calculated lighting data) to be sampled from shaders for objects in your scene instead of dynamically calculating lighting values in the shader. Using this technique can result in some serious performance improvements when memory bandwidth / sampler usage are not the bottlenecks. Unity offers the ability to bake your lights into the scenery in this fashion.
Unity also enables you to generate baked lighting data for dynamic objects using Light Probes. Light probes are points that you can place in your scene that will sample surrounding lighting and shadowing conditions. The data generated by these light probes is sampled when a dynamic object passes through a volume bound by light probes. The light/shadow values used on passing objects is interpolated between all surrounding probes. Probes placed around a scene should form a 3D volume and should be scattered more densely around areas that your dynamic object could potentially cover.
Figure 41. Left: Directional lightmap generated by Unity. Right: Intensity lightmap generated by Unity. (As shown in the GPA Frame Analyzer.)
To bake light data, mark all static geometry as static in the inspector (same checkbox as mentioned in Occlusion Culling section) and place your light probes around the scene to form a 3D volume covering all potential paths of dynamic objects where light data is to be received. Once objects are marked and light probes are placed, open the Lightmapping window via Window->Lighting and click the "Bake Scene" button.
Figure 42. Baking a scene from Lightmapping
You will see a small loading bar at the bottom right portion of the window. When the baking is complete, you’re done! You can remove/disable all dynamic lights that aren’t needed from your scene, but it is not necessary if you have your lights marked as ‘baked’ in the inspector. The baked light will automatically be applied. An easy way to keep track of the lights in your scene that are only baked is to keep them all parented under a blank GameObject for quick activation/deactivation for when you need to re-bake. Verify that your lightmap baking workflow mode is not set to auto if you go this route.
Using Simple Colliders Instead of Mesh Colliders for Complex Models
It’s important to use a combination of primitive colliders for complex objects that can be collided with instead of just throwing mesh colliders on everything. A primitive collider is a simple 3D shape (capsule, sphere, box, etc.); while a mesh collider takes the form of the mesh that you are trying to enable collision on. When possible, choose primitive colliders over mesh colliders.
Figure 43. Three primitive colliders used for this massive structure. Far greater performance than using the mesh collider.
Continue to Part 4 of the Tutorial:
Unity* Optimization Guide for Intel x86 Platforms: Part 4
Intel is inside more and more Android devices, and we have tools and resources to make your app development faster and easier.


