Introduction
The venn diagram is a kind of diagram plot for representing the relationships between the data sets. For example, in the biological research area, the Venn diagram can be used for representing the common and unique elements between the bacterial genome by using the protein BBH blastp analysis result.
Background
The R language is a kind of popular language in the data mining and machine learning, and it also is a powerful tool on the data visualization. For drawing a venn diagram in R language, a package named VennDiagram is recommended for this plots:
https://cran.r-project.org/web/packages/VennDiagram/index.html
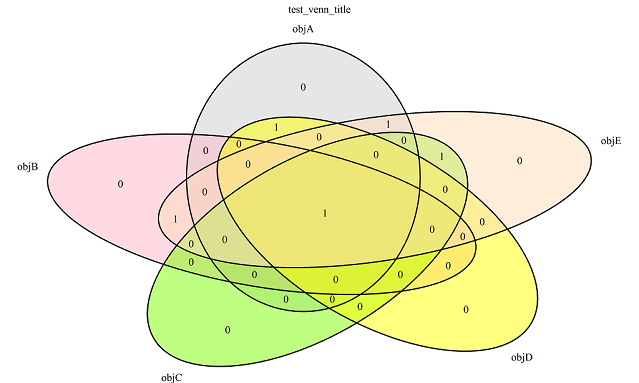
Here is a simple example of drawing the venn diagram in R language:
library(VennDiagram)

# Creates the data set
d0 <- c(3, 4, 5);
d1 <- c(2, 3);
d2 <- c(1, 3);
d3 <- c(3, 5);
d4 <- c(1, 2, 3, 4);
input_data <- list(objA=d0,objB=d1,objC=d2,objD=d3,objE=d4);

# Creates output
output_image_file <- "C:/Users/xieguigang/Desktop/venn_venn.tiff";

# Configs for the diagram
title <- "venn";
fill_color <- c("mediumorchid4","azure1","gray24","darkolivegreen3","grey13");

# Invoke drawing of the venn Diagram
venn.diagram(input_data,fill=fill_color,filename=output_image_file,
             width=5000,height=3000,main=title);
The R.Bioinformatics project is part of the component in GCModeller tools. R API port to .NET language through RDotNET project and this article is based on the R API tools from my previous article about how to build a R API for .NET language:
<R Statics Language API to VB.NET Language>
http://www.codeproject.com/Articles/1083875/R-Statics-Language-API-to-VB-NET-Language
Using the Code
Reasons of hybrids programming R with VisualBasic
In generally, the R language is not so good at large amount text process, R language is preferred for the numerical data analysis and plotting for representing your research data.
The analyzed data size in the bioinformatics research is usually bigger than 10GB and even more up to 100GB in one computational experiment, such as the blastp BBH analysis against the reference sequence database for function annotation, blastp on Pfam database for protein function structure analysis, or RNA-seq experiments on the genome function analysis. And most of the biological data is stored as plant text file to be consistent with a object-oriented database.
So that the R language needs a kind of tools language on its analysis workflow upstream to generate the clean input from the experiment data, and this workflow is usually hybrid programming with other language that high performance on large amount text data processing, such as python/R, Java/R and VisualBasic/R.
Due to .NET language benefits from the parallel Linq workflow and regular expression, this makes it possible for VisualBasic/C# language to have the capability of high performance on large size text process and can deal with any text format database.

The raw data was processing by .NET program and generated the R API input, then hybrid programming with R language through RDotNET, at last, your user code reads the raw output data from R server, finally you are able to serialize the R object as .NET object for the downstream analysis.
R hybrids workflow:
1. User code in Python, java or Visualbasic on the large size raw data to generates the R data input
2. Hybrids programming with R to generates the script workflow
3. Gets R server raw memory data from execute the script for downstream analysis.
The venn.diagram R API
The venn.diagram API has already been created in the R.Bioinformatics project. This API is available at namespace RDotNet.Extensions.Bioinformatics.VennDiagram.vennDiagramPlot which its original API details can be found from help command ??venn.diagram in R console.
Imports RDotNet.Extensions.VisualBasic
Imports RDotNet.Extensions.VisualBasic.Services.ScriptBuilder
Imports RDotNet.Extensions.VisualBasic.Services.ScriptBuilder.RTypes
Namespace VennDiagram
<RFunc("venn.diagram")> Public Class vennDiagramPlot : Inherits vennBase
Public Property x As RExpression
<Parameter("filename", ValueTypes.Path)> Public Property filename As String
Public Property height As Integer = 4000
Public Property width As Integer = 7000
Public Property resolution As Integer = 600
Public Property imagetype As String = "tiff"
Public Property units As String = "px"
Public Property compression As String = "lzw"
Public Property na As String = "stop"
Public Property main As RExpression = NULL
Public Property [sub] As RExpression = NULL
<Parameter("main.pos")> Public Property mainPos As RExpression = c(0.5, 1.05)
<Parameter("main.fontface")> Public Property mainFontface As String = "plain"
<Parameter("main.fontfamily")> Public Property mainFontfamily As String = "serif"
<Parameter("main.col")> Public Property mainCol As String = "black"
<Parameter("main.cex")> Public Property mainCex As Integer = 1
<Parameter("main.just")> Public Property mainJust As RExpression = c(0.5, 1)
<Parameter("sub.pos")> Public Property subPos As RExpression = c(0.5, 1.05)
<Parameter("sub.fontface")> Public Property subFontface As String = "plain"
<Parameter("sub.fontfamily")> Public Property subFontfamily As String = "serif"
<Parameter("sub.col")> Public Property subCol As String = "black"
<Parameter("sub.cex")> Public Property subCex As Integer = 1
<Parameter("sub.just")> Public Property subJust As RExpression = c(0.5, 1)
<Parameter("category.names")> Public Property categoryNames _
As RExpression = names("x")
<Parameter("force.unique")> Public Property forceUnique As Boolean = True
<Parameter("print.mode")> Public Property printMode As String = "raw"
Public Property sigdigs As Integer = 3
<Parameter("direct.area")> Public Property directArea As Boolean = False
<Parameter("area.vector")> Public Property areaVector As Integer = 0
<Parameter("hyper.test")> Public Property hyperTest As Boolean = False
<Parameter("total.population")> Public Property totalPopulation _
As RExpression = NULL
Public Property fill As RExpression
The VennDiagram Data Model
Steps details on R hybrids
The venn diagram data model is available at namespace:
RDotNet.Extensions.Bioinformatics.VennDiagram.ModelAPI.VennDiagram
Function for converting the data model into R script automatically:
Imports System.Drawing
Imports System.Text
Imports System.Xml.Serialization
Imports Microsoft.VisualBasic
Imports Microsoft.VisualBasic.DocumentFormat.Csv
Imports Microsoft.VisualBasic.DocumentFormat.Csv.DocumentStream
Imports Microsoft.VisualBasic.Linq
Imports Microsoft.VisualBasic.Linq.Extensions
Imports RDotNet.Extensions.VisualBasic
Imports RDotNet.Extensions.VisualBasic.Services.ScriptBuilder
Const venn__plots_out As String = NameOf(venn__plots_out)
Protected Overrides Function __R_script() As String
Dim R As ScriptBuilder = New ScriptBuilder(capacity:=5 * 1024)
Dim dataList As New List(Of String)
Dim color As New List(Of String)
For i As Integer = 0 To partitions.Length - 1
Dim x As Partition = partitions(i)
Dim objName As String = x.Name.NormalizePathString.Replace(" ", "_")
R += $"d{i} <- c({x.Vector})"
color += x.Color
dataList += $"{objName}=d{i}"
If Not String.Equals(x.Name, objName) Then
Call $"{x.Name} => '{objName}'".__DEBUG_ECHO
End If
Next
plot.categoryNames = c(partitions.ToArray(Function(x) x.DisplName))
R += $"input_data <- list({dataList.JoinBy(",")})"
R += $"fill_color <- {c(color.ToArray)}"
R += venn__plots_out <= plot.Copy("input_data", "fill_color", plot.categoryNames)
Return R.ToString
End Function
Using the Venn Diagram Model
For drawing a venn diagram directly from an existing venn diagram XML model file, you can use the code below. This code loads the venn diagram data model from an existing XML document and then you can generate the R script directly from this model:
Imports Microsoft.VisualBasic.CommandLine.Reflection
Imports Microsoft.VisualBasic.ConsoleDevice.STDIO
Imports Microsoft.VisualBasic.Scripting.MetaData
Imports Microsoft.VisualBasic.Linq
Imports Microsoft.VisualBasic.DocumentFormat.Csv
Imports RDotNET.Extensions.VisualBasic.RSystem
Imports RDotNET.Extensions.VisualBasic
Imports RDotNET.Extensions.Bioinformatics.VennDiagram.ModelAPI

Dim venn As VennDiagram = path.LoadXml(Of VennDiagram)
Dim EXPORT As String = venn.saveTiff.TrimFileExt & ".r"

Call TryInit()
Call venn.RScript.SaveTo(EXPORT, Encodings.ASCII.GetEncodings)
Call RSystem.Source(EXPORT)
Call Process.Start(venn.saveTiff)
For drawing a venn diagram from a CSV raw data file, you should convert the raw CSV dataset as the partitions in Venn diagram by using the function RModelAPI.Generate:
Private Function __run(inData As String, title As String, _
options As String, out As String, R_HOME As String) As Integer
Dim dataset As DocumentStream.File = New DocumentStream.File(inData)
Dim VennDiagram As VennDiagram = RModelAPI.Generate(source:=dataset)
If String.IsNullOrEmpty(options) Then
VennDiagram += From col As String In dataset.First Select _
{col, GetRandomColor()}
Else
VennDiagram += From s As String In options.Split(CChar(";")) _
Select s.Split(CChar(","))
End If
VennDiagram.Title = title
VennDiagram.saveTiff = out
Dim RScript As String = VennDiagram.RScript
Dim EXPORT As String = FileIO.FileSystem.GetParentPath(out)
EXPORT = $"{EXPORT}/{title.NormalizePathString}_venn.r"
If Not R_HOME.DirectoryExists Then
Call TryInit()
Else
Call TryInit(R_HOME)
End If
Call RScript.SaveTo(EXPORT, Encodings.ASCII.GetEncodings)
Call VennDiagram.SaveAsXml(EXPORT.TrimFileExt & ".Xml")
Call RSystem.Source(EXPORT)
Printf("The venn diagram r script were saved at location:\n '%s'", EXPORT)
Call Process.Start(out)
Return 0
End Function
Generates the partitions in the Venn diagram from the csv raw data:
Imports System.Drawing
Imports System.Runtime.CompilerServices
Imports System.Text
Imports System.Xml.Serialization
Imports Microsoft.VisualBasic
Imports Microsoft.VisualBasic.DocumentFormat.Csv
Imports Microsoft.VisualBasic.DocumentFormat.Csv.DocumentStream
Imports Microsoft.VisualBasic.Linq
Imports Microsoft.VisualBasic.Linq.Extensions
Imports RDotNET.Extensions.VisualBasic
Namespace VennDiagram.ModelAPI
Public Module RModelAPI
Public Function Generate(source As DocumentStream.File) As VennDiagram
Dim LQuery = From vec
In __vector(source:=source)
Select New Partition With {
.Vector = String.Join(", ", vec.Value),
.Name = vec.Key
}
Return New VennDiagram With {
.partitions = LQuery.ToArray
}
End Function
Private Function __vector(source As File) As Dictionary(Of String, String())
Dim Width As Integer = source.First.Count
Dim Vector = (From name As String
In source.First
Select k = name,
lst = New List(Of String)).ToArray
For row As Integer = 1 To source.RowNumbers - 1
Dim Line As RowObject = source(row)
For colums As Integer = 0 To Width - 1
If Not String.IsNullOrEmpty(Line.Column(colums).Trim) Then
Call Vector(colums).lst.Add(CStr(row))
End If
Next
Next
Return Vector.ToDictionary(Function(x) x.k, Function(x) x.lst.ToArray)
End Function
Running the Example Tools
An example tools for the venn diagram plots in the VisualBasic has already been released on github. You can download this example application from the example link, and type venn man in the console for getting the help manual of the venn tools:
E:\GCModeller\GCModeller-x64\Templates>venn man
GCModeller [version 1.3.11.2]
Module AssemblyName: file:
Root namespace: LANS.SystemsBiology.AnalysisTools.DataVisualization.VennDiagramTools
All of the command that available in this program has been list below:
.Draw: Draw the venn diagram from a csv data file,
you can specific the diagram drawing options from this command switch value.
The generated venn dragram will be saved as tiff file format.
Commands
--------------------------------------------------------------------------------
1. Help for command '.Draw':
Information: Draw the venn diagram from a csv data file,
you can specific the diagram drawing options from this
command switch value. The generated venn dragram will be
saved as tiff file format.
Usage: E:\GCModeller\GCModeller-x64\venn.exe .Draw -i <csv_file>
[-t <diagram_title> -o <_diagram_saved_path>
-s <partitions_option_pairs> -rbin <r_bin_directory>]
Example: venn .Draw .Draw -i /home/xieguigang/Desktop/genomes.csv
-t genome-compared -o ~/Desktop/xcc8004.tiff -s "Xcc8004,
blue,Xcc 8004;ecoli,green,Ecoli. K12;pa14,yellow,PA14;ftn,
black,FTN;aciad,red,ACIAD"
Parameters information:
---------------------------------------
-i
Description: The csv data source file for drawing the venn diagram graph.
Example: -i "/home/xieguigang/Desktop/genomes.csv"
[-t]
Description: Optional, the venn diagram title text
Example: -t "genome-compared"
[-o]
Description: Optional, the saved file location for the venn diagram,
if this switch value is not specific by the user then
the program will save the generated venn diagram to
user desktop folder and using the file name of the input
csv file as default.
Example: -o "~/Desktop/xcc8004.tiff"
[-s]
Description: Optional, the profile settings for the partitions
in the venn diagram, each partition profile data is
in a key value paired like: name,color,
and each partition profile pair is seperated by a ';' character.
If this switch value is not specific by the user then
the program will trying to parse the partition name
from the column values and apply for each partition a randomize color.
Example: -s "Xcc8004,blue,Xcc 8004;ecoli,green,Ecoli. K12;
pa14,yellow,PA14;ftn,black,FTN;aciad,red,ACIAD"
[-rbin]
Description: Optional, Set up the r bin path for drawing the venn diagram,
if this switch value is not specific by the user then
the program just output the venn diagram drawing R script file
in a specific location, or if this switch
value is specific by the user and is valid for call the R program
then will output both venn diagram tiff image file and R script
for drawing the output venn diagram.
This switch value is just for the windows user,
when this program was running on a LINUX/UNIX/MAC platform
operating system, you can ignore this switch value,
but you should install the R program in your linux/MAC first
if you wish to get the venn diagram directly from this program.
Example: -rbin "C:\\R\\bin\\"
Using the example utils CLI:
venn .Draw -i <csv_file> [-t <diagram_title> -o <_diagram_saved_path>
           -s <serials_option_pairs> -rbin <r_bin_directory>]
A CLI example is:
venn .Draw -i "E:\GCModeller\GCModeller-x64\Templates\venn.csv"
           -t "test example plot title" -s objA,blue,"Object Test A";objB,
           red,"BBBB";objC,green,"3333333";objD,black,"DEFGGG, HI";objE,yellow,"Good!!"
The running result output of the example


