Introduction
Starting from SQL Server 2005, the default trace is enabled by default on every SQL server. Default trace is a lightweight system trace, which stores a lot of useful information about the changes in the system. It resides in the SQL Server installation directory and consists of five files with extension .trc. A new trace file is automatically created each time when the server is started, and the earliest one is erased. New events are always recorded to the most recent file, the size of which is limited to 20 MB. If the size is exceeded, a new file will be created, and this behavior can’t be changed. Only one thing you can... enable or disable this functionality:
EXEC sys.sp_configure 'show advanced options', 1
GO
RECONFIGURE WITH OVERRIDE
GO

EXEC sys.sp_configure 'default trace enabled', 0
GO
RECONFIGURE WITH OVERRIDE
GO
Use the following query to check whether the default trace is enabled:
SELECT name, value
FROM sys.configurations
WHERE configuration_id = 1568
The default trace directory:
SELECT [path], start_time, last_event_time, event_count
FROM sys.traces
WHERE is_default = 1
Let's see what kind of events can be stored in the default trace:
SELECT e.trace_event_id, e.name, c.category_id, c.name
FROM sys.trace_categories c
JOIN sys.trace_events e ON c.category_id = e.category_id
trace_event_id name                       category_id name
-------------- -------------------------- ----------- -----------------------------------
196            CLR                        20          Assembly Load
92             Database                   2           Data File Auto Grow
93             Database                   2           Log File Auto Grow
94             Database                   2           Data File Auto Shrink
95             Database                   2           Log File Auto Shrink
79             Errors and Warnings        3           Missing Column Statistics
80             Errors and Warnings        3           Missing Join Predicate
67             Errors and Warnings        3           Execution Warnings
69             Errors and Warnings        3           Sort Warnings
55             Errors and Warnings        3           Hash Warning
21             Errors and Warnings        3           EventLog
22             Errors and Warnings        3           ErrorLog
213            Errors and Warnings        3           Database Suspect Data Page
214            Errors and Warnings        3           CPU threshold exceeded
46             Objects                    5           Object:Created
47             Objects                    5           Object:Deleted
164            Objects                    5           Object:Altered
...
1. Auto Grow Events
It is no secret that any transaction requires a certain space on the disk, in the data file or log. If there is not enough space, the file size increases automatically. At that moment, the file is blocked and SQL Server will wait for the disk subsystem to make the necessary operations to allocate space on the disk.
By default, SQL Server pre-initiates a new space on the disk. For data files, this behavior can be disabled with Instant File Initialization. However, for the log file, the initialization is still going to happen, and this is definitely slow. Therefore, I recommend tracking Auto Grow events on a regular basis:
SELECT
StartTime
, Duration = Duration / 1000
, DatabaseName = DB_NAME(DatabaseID)
, [FileName]
, GrowType = CASE WHEN EventClass = 92 THEN 'DATA' ELSE 'LOG' END
FROM sys.traces i
CROSS APPLY sys.fn_trace_gettable([path], DEFAULT) t
WHERE t.EventClass IN (
92,
93
)
AND i.is_default = 1
and if their number increases dramatically:
StartTime                EndTime                  Duration    DatabaseName           FileName                  GrowType
------------------------ ------------------------ ----------- -------------------   -----------------------    --------
2016-01-16 02:52:48.127  2016-01-16 02:52:48.163  36          tempdb                 templog                   LOG
2016-01-16 02:52:49.090  2016-01-16 02:52:49.140  50          tempdb                 tempdev                   DATA
2016-01-16 02:52:50.687  2016-01-16 02:52:50.903  216         tempdb                 tempdev                   DATA
2016-01-16 02:52:51.213  2016-01-16 02:52:51.257  43          tempdb                 tempdev                   DATA
2016-01-16 02:52:52.300  2016-01-16 02:52:53.060  760         tempdb                 tempdev                   DATA
2016-01-16 02:52:54.090  2016-01-16 02:52:54.360  270         tempdb                 tempdev                   DATA
2016-01-16 02:52:55.407  2016-01-16 02:52:55.680  273         tempdb                 tempdev                   DATA
2016-01-16 02:52:56.720  2016-01-16 02:52:57.007  286         tempdb                 tempdev                   DATA
2016-01-16 02:52:58.047  2016-01-16 02:52:58.253  206         tempdb                 tempdev                   DATA
2016-01-16 02:52:59.317  2016-01-16 02:52:59.830  513         tempdb                 tempdev                   DATA
2016-01-16 02:53:01.917  2016-01-16 02:53:02.280  363         tempdb                 tempdev                   DATA
2016-01-16 02:53:03.387  2016-01-16 02:53:03.687  300         tempdb                 tempdev                   DATA
2016-01-16 02:53:05.757  2016-01-16 02:53:06.060  303         tempdb                 tempdev                   DATA
2016-01-16 02:53:08.143  2016-01-16 02:53:08.343  200         tempdb                 tempdev                   DATA
2016-01-16 02:53:10.440  2016-01-16 02:53:10.500  60          tempdb                 tempdev                   DATA
2016-01-16 02:53:12.703  2016-01-16 02:53:13.053  350         tempdb                 tempdev                   DATA
2016-01-16 02:53:15.150  2016-01-16 02:53:15.520  370         tempdb                 tempdev                   DATA
2016-01-16 02:53:17.653  2016-01-16 02:53:17.897  243         tempdb                 tempdev                   DATA
2016-01-16 02:53:21.030  2016-01-16 02:53:21.477  446         tempdb                 tempdev                   DATA
2016-01-16 02:53:25.490  2016-01-16 02:53:25.653  163         tempdb                 tempdev                   DATA
2016-01-16 02:53:30.870  2016-01-16 02:53:31.157  286         tempdb                 tempdev                   DATA
2016-01-16 02:53:36.707  2016-01-16 02:53:37.133  426         tempdb                 tempdev                   DATA
2016-01-16 02:53:42.663  2016-01-16 02:53:43.040  376         tempdb                 tempdev                   DATA
2016-01-16 02:53:49.787  2016-01-16 02:53:49.907  120         tempdb                 tempdev                   DATA
2016-01-16 02:53:58.640  2016-01-16 02:53:58.840  200         tempdb                 tempdev                   DATA
2016-01-16 02:54:06.870  2016-01-16 02:54:07.057  186         tempdb                 tempdev                   DATA
2016-01-16 02:54:17.063  2016-01-16 02:54:17.107  43          tempdb                 tempdev                   DATA
2016-01-16 02:54:27.363  2016-01-16 02:54:27.370  6           tempdb                 tempdev                   DATA
2016-01-16 02:54:42.107  2016-01-16 02:54:42.110  3           tempdb                 tempdev                   DATA
2016-01-16 02:55:04.883  2016-01-16 02:55:04.913  30          tempdb                 tempdev                   DATA
2016-01-16 14:19:47.607  2016-01-16 14:19:47.670  63          AdventureWorks2012     AdventureWorks2012_Log    LOG
2016-01-16 14:19:47.820  2016-01-16 14:19:47.840  20          AdventureWorks2012     AdventureWorks2012_Log    LOG
2016-01-16 16:51:32.980  2016-01-16 16:51:33.080  100         tempdb                 tempdev                   DATA
2016-02-16 17:31:02.260  2016-02-16 17:31:02.327  66          tempdb                 templog                   LOG
...
This may cause not only the file fragmentation, but also substantial delays in queries performance:
SELECT
      GrowType = CASE WHEN EventClass = 92 THEN 'DATA' ELSE 'LOG' END
    , GrowCount = COUNT(1)
    , Duration = SUM(Duration) / 1000
FROM sys.traces i
CROSS APPLY sys.fn_trace_gettable([path], DEFAULT) t
WHERE t.EventClass IN (92, 93)
    AND i.is_default = 1
    AND t.DatabaseID = DB_ID('tempdb')
GROUP BY EventClass
GrowType GrowCount Duration
DATA 36 7296
LOG 2 102
Let's look at the settings of the problem database:
USE tempdb
GO

SELECT
      d.type_desc
    , d.name
    , d.physical_name
    , current_size_mb = ROUND(d.size * 8. / 1024, 0)
    , initial_size_mb = ROUND(m.size * 8. / 1024, 0)
    , auto_grow =
        CASE WHEN d.is_percent_growth = 1
            THEN CAST(d.growth AS VARCHAR(10)) + '%'
            ELSE CAST(ROUND(d.growth * 8. / 1024, 0) AS VARCHAR(10)) + 'MB'
        END
FROM sys.database_files d
JOIN sys.master_files m ON d.[file_id] = m.[file_id]
WHERE m.database_id = DB_ID('tempdb')
The initial database size: 8 MB for the data file and 1MB for the log:
type_desc name physical_name current_size_mb initial_size_mb auto_grow
ROWS tempdev D:\SQL_2012\DATA\tempdb.mdf 258.000000 8.000000 10%
LOG templog D:\SQL_2012\DATA\templog.ldf 3.000000 1.000000 1MB
...which is clearly not enough when compared to the current size. Moreover, we must remember that at every restart, SQL Server recreates tempdb. As a result, the next time you start SQL Server, you get the file of 9 MB, query execution delays and a new batch of messages in the default trace.
How to deal with this problem? Monitor the size of files and reserve free space for them:
SELECT
      s.[file_id]
    , s.name
    , size = CAST(s.size * 8. / 1024 AS DECIMAL(18,2))
    , space_used = CAST(t.space_used * 8. / 1024 AS DECIMAL(18,2))
    , free_space = CAST((s.size - t.space_used) * 8. / 1024 AS DECIMAL(18,2))
    , used_percent = CAST(t.space_used * 100. / s.size AS DECIMAL(18,2))
    , s.max_size
    , s.growth
    , s.is_percent_growth
FROM sys.database_files s
CROSS APPLY (
    SELECT space_used = FILEPROPERTY(s.name, 'SpaceUsed')
) t
2. Auto Shrink Events
Recently, I wrote that the AUTO_CLOSE option reduces performance. Well, AUTO_SHRINK goes worse. Every 30 minutes, SQL Server tries to shrink a free space in DB files. This process is very resource-intensive and can lead to fragmentation of files on the disk. The file shrink may lead to high index fragmentation; increases logical reads and reduces query performance.
SELECT
StartTime
, EndTime
, Duration = Duration / 1000
, DatabaseName = DB_NAME(DatabaseID)
, [FileName]
, GrowType = CASE WHEN EventClass = 94 THEN 'DATA' ELSE 'LOG' END
, NTDomainName
, ApplicationName
, LoginName
, TextData
, IsSystem
FROM sys.traces i
CROSS APPLY sys.fn_trace_gettable([path], DEFAULT) t
WHERE t.EventClass IN (
94,
95
)
AND i.is_default = 1
StartTime EndTime Duration DatabaseName FileName GrowType
2016-02-10 11:57:54.333 2016-02-10 11:57:54.450 116 AdventureWorks2012 AdventureWorks2012_Log LOG
2016-02-10 14:58:21.087 2016-02-10 14:58:21.200 113 AdventureWorks2012 AdventureWorks2012_Log LOG
2016-02-10 19:30:02.350 2016-02-10 19:30:02.463 113 AdventureWorks2012 AdventureWorks2012_Log LOG
2016-02-10 21:00:26.083 2016-02-10 21:00:26.100 16 AdventureWorks2012 AdventureWorks2012_Log LOG
I definitely recommend disabling this option for all databases:
SELECT 'ALTER DATABASE ' + QUOTENAME(name) + ' SET AUTO_SHRINK OFF WITH NO_WAIT;'
FROM sys.databases
WHERE is_auto_shrink_on = 1
3. DBCC Events
Another useful feature of the default trace is the ability to track when and who ran DBCC commands. It's no good blaming CHECKDB for DBCC, but if someone madly executes on a production database:
DBCC SHRINKDATABASE
DBCC FREEPROCCACHE
DBCC DROPCLEANBUFFERS
it can be easily traced:
SELECT t.TextData, t.ApplicationName, t.LoginName, t.StartTime
FROM sys.traces i
CROSS APPLY sys.fn_trace_gettable([path], DEFAULT) t
WHERE i.is_default = 1
AND t.EventClass = 116
AND t.ApplicationName IS NOT NULL
TextData ApplicationName LoginName StartTime
DBCC SHRINKDATABASE(1) SSMS - Query PC\IgorS 2016-02-10 20:03:46.307
DBCC FREEPROCCACHE SSMS - Query PC\IgorS 2016-02-10 20:03:43.430
DBCC DROPCLEANBUFFERS SSMS - Query PC\IgorS 2016-02-10 20:03:44.767
4. Errors and Warnings Events
In the situation when SQL Server does not have enough free memory capacity, which is required to execute a query, the results of some operators will be processed in tempdb. The same behavior will be observed when the optimizer makes incorrect assessment of the expected number of rows.
Let's try to write a query that will call spills in tempdb:
SELECT *
FROM Sales.SalesOrderHeader
WHERE DueDate > ShipDate
ORDER BY OrderDate DESC
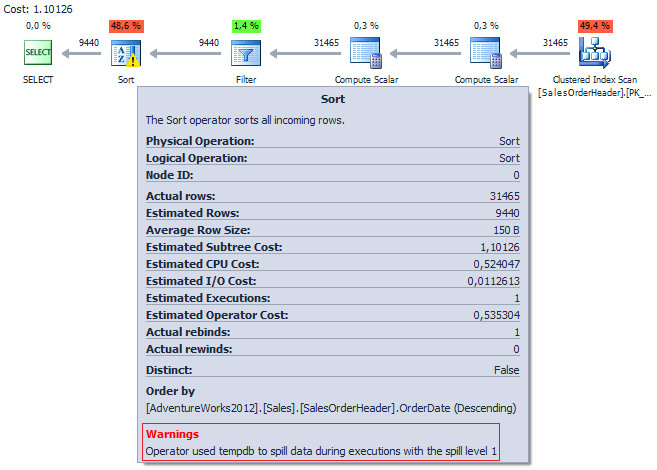
Thanks to a message from the default trace, we can track such queries:
SELECT TOP(10)
      EventName = e.name
    , t.TextData
    , t.ApplicationName
    , t.LoginName
    , t.StartTime
    , DatabaseName = DB_NAME(t.DatabaseID)
FROM sys.traces i
CROSS APPLY sys.fn_trace_gettable([path], DEFAULT) t
JOIN sys.trace_events e ON e.trace_event_id = t.EventClass
WHERE i.is_default = 1
    AND e.category_id = 3
ORDER BY t.StartTime DESC
EventName ApplicationName LoginName StartTime DatabaseName
Sort Warnings SSMS - Query PC\SergeyS 2016-02-11 13:06:44.867 AdventureWorks2012
We can find the execution plan and optimize the query:
USE AdventureWorks2012
GO
SELECT TOP(5)
      p.query_plan
    , e.[text]
    , qyery_cost = p.query_plan.value(
            '(/*:ShowPlanXML/*:BatchSequence/*:Batch/*:Statements/*:StmtSimple/@StatementSubTreeCost)[1]',
            'FLOAT'
        )
    , s.last_execution_time
    , last_exec_ms = s.last_worker_time / 1000
    , s.execution_count
FROM sys.dm_exec_query_stats s
CROSS APPLY sys.dm_exec_query_plan(s.plan_handle) p
CROSS APPLY sys.dm_exec_sql_text(s.plan_handle) e
WHERE e.[text] NOT LIKE '%sys%'
    AND s.last_execution_time >= DATEADD(MS, -2500, '2016-02-10 19:41:45.983')
    AND e.[dbid] = DB_ID()
ORDER BY s.last_execution_time
query_plan text qyery_cost last_execution_time last_exec_ms execution_count
ShowPlanXML ... SELECT * FROM Sales.SalesOrderHeader... 1,10126 2016-02-11 13:06:44.850 1538 1
By the way, actual execution plans are not available in DMV. They can be obtained only at the stage of Post Query Execution Showplan through a corresponding Trace event, or by means of SET STATISTICS XML ON. Starting from SQL Server 2012, a new XEvent – post_query_execution_showplan – was added specifically for this purpose.
I am happy with the ability to track some type of warnings:
SELECT DISTINCT d.SalesOrderID, d.UnitPrice, h.OrderDate
FROM Sales.SalesOrderHeader h
JOIN Sales.SalesOrderDetail d ON h.SalesOrderID = d.SalesOrderID
WHERE h.DueDate > h.ShipDate
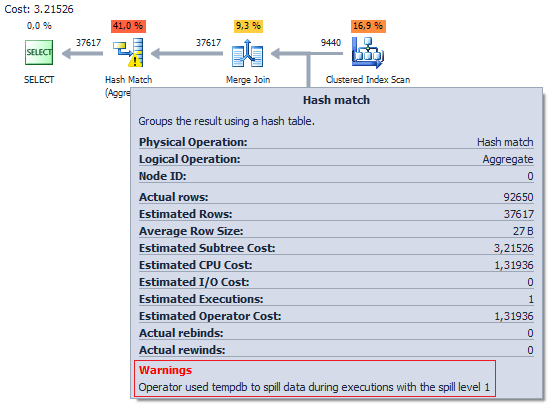
EventName ApplicationName LoginName StartTime DatabaseName
Hash Warning SSMS - Query PC\SergeyS 2016-02-11 13:14:44.433 AdventureWorks2012
For example, when you forget to specify JOIN between tables:
SELECT *
FROM Sales.Currency c, Sales.CountryRegionCurrency r
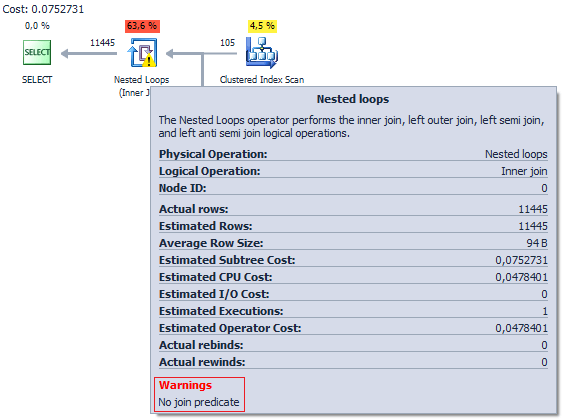
EventName ApplicationName LoginName StartTime DatabaseName
Missing Join Predicate SSMS - Query PC\SergeyS 2016-02-11 13:18:20.507 AdventureWorks2012
or when a column being filtered does not have stats:
SELECT DatabaseLogID
FROM dbo.DatabaseLog
WHERE PostTime = '2012-03-14 13:14:18.847'
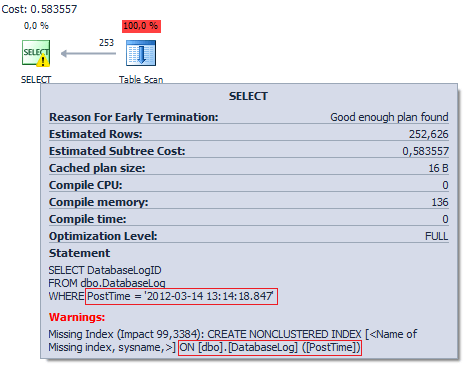
EventName TextData .. LoginName StartTime DatabaseName
Missing Column Statistics NO STATS:([dbo].[DatabaseLog].[PostTime]) .. PC\SergeyS 2016-02-11 13:19:39.813 AdventureWorks2012
5. Object Events
In the default trace, you can track the object changes:
USE [master]
GO
IF DB_ID('test') IS NOT NULL
    DROP DATABASE [test]
GO
CREATE DATABASE [test]
GO
USE [test]
GO
CREATE TABLE dbo.tbl (ID INT)
GO
ALTER TABLE dbo.tbl ADD Col VARCHAR(20)
GO
CREATE UNIQUE CLUSTERED INDEX ix ON dbo.tbl (ID)
GO
USE [master]
GO
IF DB_ID('test') IS NOT NULL
    DROP DATABASE [test]
GO
SELECT
      EventType = e.name
    , t.DatabaseName
    , t.ApplicationName
    , t.LoginName
    , t.StartTime
    , t.ObjectName
    , ObjectType =
        CASE t.ObjectType
            WHEN 8259 THEN 'Check Constraint'
            WHEN 8260 THEN 'Default Constraint'
            WHEN 8262 THEN 'Foreign Key'
            WHEN 8272 THEN 'Stored Procedure'
            WHEN 8274 THEN 'Rule'
            WHEN 8275 THEN 'System Table'
            WHEN 8276 THEN 'Server Trigger'
            WHEN 8277 THEN 'Table'
            WHEN 8278 THEN 'View'
            WHEN 8280 THEN 'Extended Stored Procedure'
            WHEN 16724 THEN 'CLR Trigger'
            WHEN 16964 THEN 'Database'
            WHEN 17222 THEN 'FullText Catalog'
            WHEN 17232 THEN 'CLR Stored Procedure'
            WHEN 17235 THEN 'Schema'
            WHEN 17985 THEN 'CLR Aggregate Function'
            WHEN 17993 THEN 'Inline Table-valued SQL Function'
            WHEN 18000 THEN 'Partition Function'
            WHEN 18004 THEN 'Table-valued SQL Function'
            WHEN 19280 THEN 'Primary Key'
            WHEN 19539 THEN 'SQL Login'
            WHEN 19543 THEN 'Windows Login'
            WHEN 20038 THEN 'Scalar SQL Function'
            WHEN 20051 THEN 'Synonym'
            WHEN 20821 THEN 'Unique Constraint'
            WHEN 21075 THEN 'Server'
            WHEN 21076 THEN 'Transact-SQL Trigger'
            WHEN 21313 THEN 'Assembly'
            WHEN 21318 THEN 'CLR Scalar Function'
            WHEN 21321 THEN 'Inline scalar SQL Function'
            WHEN 21328 THEN 'Partition Scheme'
            WHEN 21333 THEN 'User'
            WHEN 21572 THEN 'Database Trigger'
            WHEN 21574 THEN 'CLR Table-valued Function'
            WHEN 21587 THEN 'Statistics'
            WHEN 21825 THEN 'User'
            WHEN 21827 THEN 'User'
            WHEN 21831 THEN 'User'
            WHEN 21843 THEN 'User'
            WHEN 21847 THEN 'User'
            WHEN 22601 THEN 'Index'
            WHEN 22611 THEN 'XMLSchema'
            WHEN 22868 THEN 'Type'
        END
FROM sys.traces i
CROSS APPLY sys.fn_trace_gettable([path], DEFAULT) t
JOIN sys.trace_events e ON t.EventClass = e.trace_event_id
WHERE e.name IN ('Object:Created', 'Object:Deleted', 'Object:Altered')
    AND t.ObjectType != 21587
    AND t.DatabaseID != 2
    AND i.is_default = 1
    AND t.EventSubClass = 1
EventType DatabaseName ApplicationName LoginName StartTime ObjectName ObjectType
Object:Created test SSMS - Query PC\SergeyS 2016-02-11 13:36:46.727 NULL Database
Object:Created test SSMS - Query PC\SergeyS 2016-02-11 13:36:46.760 tbl Table
Object:Altered test SSMS - Query PC\SergeyS 2016-02-11 13:36:46.803 tbl Table
Object:Created test SSMS - Query PC\SergeyS 2016-02-11 13:36:46.837 ix Index
Object:Deleted test SSMS - Query PC\SergeyS 2016-02-11 13:36:56.347 NULL Database
6. Server Events
Also, you can keep track of who and when did backups and restored databases through the default trace:
SELECT
CASE WHEN t.EventSubClass = 1
THEN 'BACKUP'
ELSE 'RESTORE'
END, t.TextData, t.ApplicationName, t.LoginName, t.StartTime
FROM sys.traces i
CROSS APPLY sys.fn_trace_gettable([path], DEFAULT) t
WHERE i.is_default = 1
AND t.EventClass = 115
TextData ApplicationName LoginName StartTime
BACKUP DATABASE SSMS - Query PC\SergeyS 2016-01-21 13:05:26.390
RESTORE DATABASE dbForge Studio for SQL Server PC\SergeyS 2016-01-22 12:46:45.717
BACKUP DATABASE SQLCMD sa 2016-01-24 10:16:40.317
or track memory usage by SQL Server:
SELECT
t.StartTime
, [Type] = CASE WHEN EventSubClass = 1 THEN 'UP' ELSE 'DOWN' END
, t.IntegerData
FROM sys.traces i
CROSS APPLY sys.fn_trace_gettable([path], DEFAULT) t
WHERE t.EventClass = 81
AND i.is_default = 1
StartTime Type IntegerData
2016-02-10 02:52:42.887 UP 191
2016-02-10 02:53:00.640 UP 371
2016-02-10 02:53:34.917 UP 734
2016-02-10 02:53:52.140 UP 916
2016-02-10 10:05:00.027 DOWN 736
2016-02-10 10:17:17.417 UP 921
2016-02-10 11:52:14.930 DOWN 735
2016-02-10 12:00:32.577 DOWN 553
2016-02-10 13:06:11.540 UP 751
2016-02-10 15:11:10.487 UP 936
2016-02-10 15:15:26.107 DOWN 714
Postscript
The default trace is quite a good opportunity for monitoring a server health. Of course, it has many shortcomings, such as the restriction to 20Mb and a Microsoft's declaration that this functionality is deprecated starting with SQL Server 2008. Yet sometimes, the default trace is very useful at the initial stage of diagnosing problems associated with SQL Server.
Everything was tested on Microsoft SQL Server 2012 (SP3) (KB3072779) - 11.0.6020.0 (X64).
All execution plans from dbForge Studio for SQL Server.
SQL Server DBA/DB Developer with 10+ years of experience in SQL Server 2005-2019, Azure/GCP. Worked on high-load OLTP/DW projects and develops system tools for SQL Server. In depth understanding of SQL Server Engine and experience in working with big databases. Domain knowledge of ERP/CRM, crawlers, gambling and retail sales. Blogger, mentor and speaker at local SQL Server events.


 General
  News
News  Suggestion
  Question
  Bug
Bug  Answer
  Joke
Joke  Praise
  Rant
Rant  Admin
Admin 


